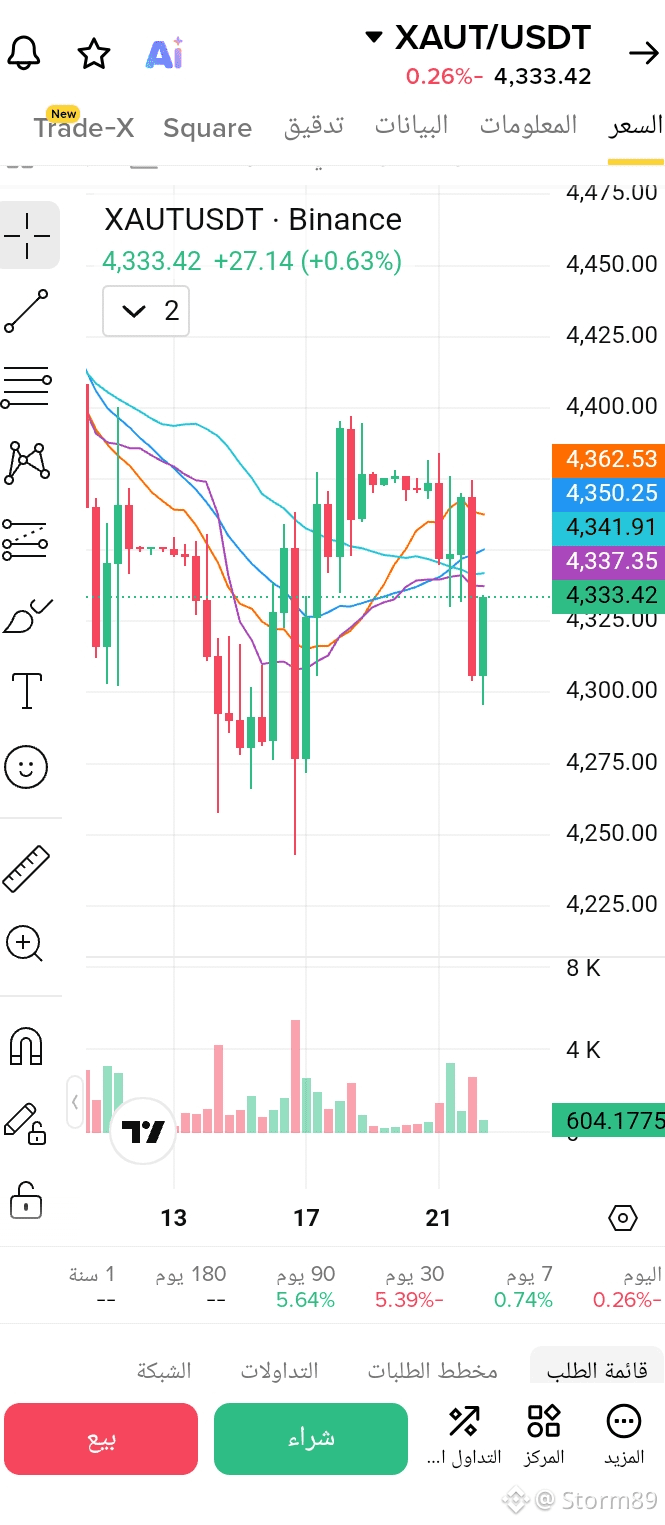
If we go a bit back, we’ll see the strong rebound that happened around day 17 with clear buying volume—this is decisive proof that liquidity entered and strongly hunted the lows.
The candles are competing and trading beneath a tangled cluster of Moving Averages centered around levels 4337, 4341, 4350, and 4362. The current red candle confirms this temporary selling pressure, and the price needs real momentum to break through these resistances and break upward.
Random entry in this range between the moving averages is an uncalculated technical risk.
Technically, the best approach is to either wait for a clear breakout and a close above the resistance band (above 4362) to confirm the bullish outlook, or wait for the price to test the previous lows to enter from stronger support zones.
$XAUT
The candles are competing and trading beneath a tangled cluster of Moving Averages centered around levels 4337, 4341, 4350, and 4362. The current red candle confirms this temporary selling pressure, and the price needs real momentum to break through these resistances and break upward.
Random entry in this range between the moving averages is an uncalculated technical risk.
Technically, the best approach is to either wait for a clear breakout and a close above the resistance band (above 4362) to confirm the bullish outlook, or wait for the price to test the previous lows to enter from stronger support zones.
$XAUT