👀 What to expect from BTC today? 👀
Hey, Binance Square crew! Let’s take a quick look at the Bitcoin chart today.
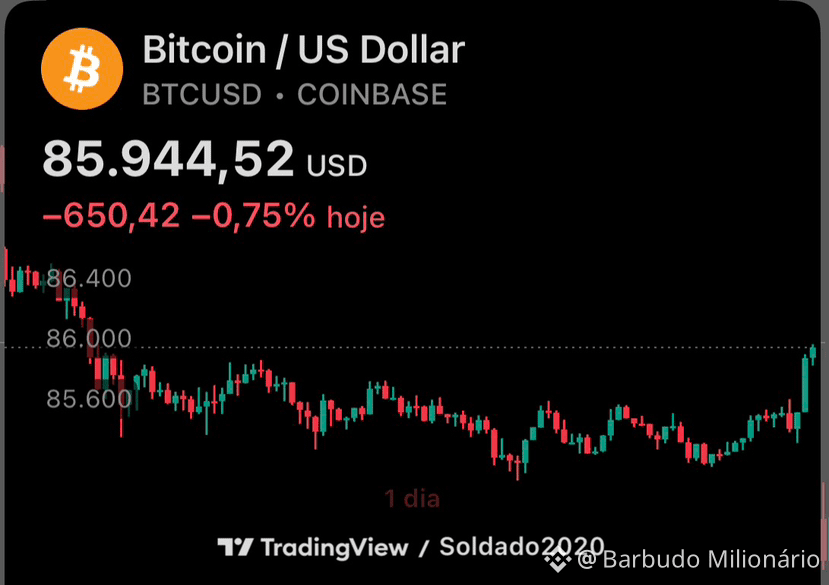
On the BTC daily chart, the price is moving around $85,944, with a slight drop of -0.75% for the day.
Key points I’m watching:
1. Resistance: The chart shows the price tried to rise at the beginning of the day, getting close to $86,400, but it couldn’t.
This range between $86,200 and $86,400 is the first major barrier to break. The BTC needs strength to break above $86,000 and consolidate over it to change the short-term bias.
2. Support: On the other hand, the chart also shows where buyers are holding the wave.
The price bounced and pulled back a few times in the $85,400 - $85,600 region. This is the main support level right now.
If this range is lost, the price could quickly seek lower levels.
The BTC is in a consolidation move and a mild correction after yesterday’s highs.
In the short term, the trend is downward as long as it doesn’t break $86,000 with volume.
I’d keep an eye on these two key levels. A break below $85,400 signals caution.
A breakout above $86,200 reactivates the “bullish” mode. The day looks like a “fight” between bulls and bears within this price range.
Disclaimer: This is not investment advice—just a simple chart analysis. DYOR (do your own research).
Hey, Binance Square crew! Let’s take a quick look at the Bitcoin chart today.
On the BTC daily chart, the price is moving around $85,944, with a slight drop of -0.75% for the day.
Key points I’m watching:
1. Resistance: The chart shows the price tried to rise at the beginning of the day, getting close to $86,400, but it couldn’t.
This range between $86,200 and $86,400 is the first major barrier to break. The BTC needs strength to break above $86,000 and consolidate over it to change the short-term bias.
2. Support: On the other hand, the chart also shows where buyers are holding the wave.
The price bounced and pulled back a few times in the $85,400 - $85,600 region. This is the main support level right now.
If this range is lost, the price could quickly seek lower levels.
The BTC is in a consolidation move and a mild correction after yesterday’s highs.
In the short term, the trend is downward as long as it doesn’t break $86,000 with volume.
I’d keep an eye on these two key levels. A break below $85,400 signals caution.
A breakout above $86,200 reactivates the “bullish” mode. The day looks like a “fight” between bulls and bears within this price range.
Disclaimer: This is not investment advice—just a simple chart analysis. DYOR (do your own research).