$85,400 BTC—did you chase it up?
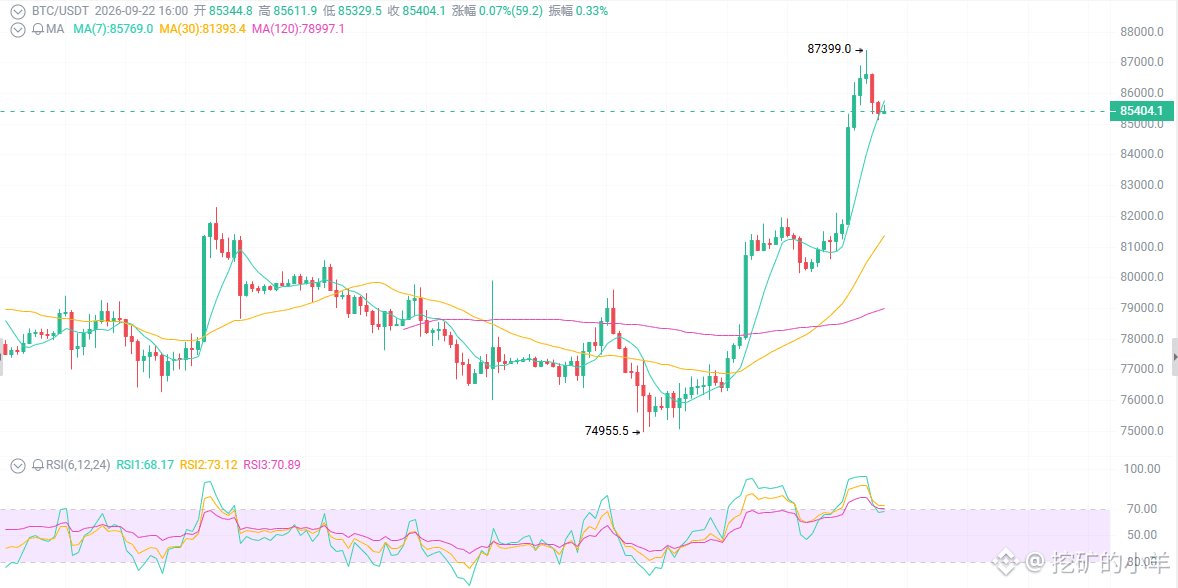
First, look at the surface: in the past 4 trading days it’s risen by over 13%. This isn’t a slow bull climb—it’s shorts getting squeezed upward. In the last 24 hours alone, liquidations exceeded $1 billion, with a trail of short positions wiped out. Market cap has returned to high levels. ETF cumulative assets under management are around the 110 billion USD mark. Strategy bought another 950 coins, taking holdings back to 846,000. The 50-week moving average (around 78k) has regained its footing, and the upper boundary of the descending channel has been broken. But RSI has surged to 69–73, entering the overbought zone. The trend is still bullish, but the price position is expensive.
First thing: this rally isn’t powered by coins—it’s powered by the shorts’ bodies.
Within 24 hours, shorts were liquidated from $650 million to $840 million, and total liquidations across the market exceeded $1 billion. The ETF posted a net inflow of $999 million in a single day—one of the biggest single-day inflows in the last 11 months. BlackRock, ARK, and Fidelity led across the board.
Those who were short got swept away by a move, forced to cover and buy—forming a “short squeeze.”
ETF funds flowed back, institutions re-entered at lower levels.
Strategy continued buying, and the corporate treasury restart-buying resumed.
Second thing: the Fed hiked rates, but BTC didn’t crash.
On September 16, the Fed raised 25 bp to 3.75%–4.00%, the first time in more than three years. At that moment BTC was digesting around 75k–76k. It didn’t break down; instead, it ran all the way to 87k.
The market stopped following the “rate hike must lead to a drop” script, and instead moved according to “risk appetite + ETF flows.” Falling oil prices, falling U.S. Treasury yields, and expectations for the U.S.–China summit—all helped compress the safe-haven premium, and risk assets broadly warmed up.
Third thing: the technicals tell you—don’t chase at 85.4k.
On September 21, a long bullish candle broke above the prior high at 82k–83k, and the high reached 87,400.
Today’s pullback to 85,400 is a normal retest after a breakout; the structure hasn’t been broken.
RSI at 69–73 is overbought, making chasing very poor in terms of risk-reward.
The MACD golden cross is still there, but after the expansion of the histogram, it tends to drift into digestion.
Resistance levels: 87,300–87,500 → 90,000 → 93,000
Support levels: 84,000 → 82,300–82,600 → 80,000–81,000 → 78,000
Trading strategy
For short-term traders:
Wait for a pullback to 84,000–82,600, then buy in batches after a low-volume stabilization and 4H lower wicks. Stop loss below 82,000. First target 87,000–87,400, second target 90,000.
For breakout chasing:
Only chase with a light position if the 1D or 4H closes firmly above 87,500 and the ETF continues net inflows. Targets 90k–93k.
For bearish/hedging:
88,600–87,400 is repeatedly capped and price action lacks momentum/volume. Take a light-position pullback trade with targets 84k/82.6k. Stop loss if above 87,600.
First, look at the surface: in the past 4 trading days it’s risen by over 13%. This isn’t a slow bull climb—it’s shorts getting squeezed upward. In the last 24 hours alone, liquidations exceeded $1 billion, with a trail of short positions wiped out. Market cap has returned to high levels. ETF cumulative assets under management are around the 110 billion USD mark. Strategy bought another 950 coins, taking holdings back to 846,000. The 50-week moving average (around 78k) has regained its footing, and the upper boundary of the descending channel has been broken. But RSI has surged to 69–73, entering the overbought zone. The trend is still bullish, but the price position is expensive.
First thing: this rally isn’t powered by coins—it’s powered by the shorts’ bodies.
Within 24 hours, shorts were liquidated from $650 million to $840 million, and total liquidations across the market exceeded $1 billion. The ETF posted a net inflow of $999 million in a single day—one of the biggest single-day inflows in the last 11 months. BlackRock, ARK, and Fidelity led across the board.
Those who were short got swept away by a move, forced to cover and buy—forming a “short squeeze.”
ETF funds flowed back, institutions re-entered at lower levels.
Strategy continued buying, and the corporate treasury restart-buying resumed.
Second thing: the Fed hiked rates, but BTC didn’t crash.
On September 16, the Fed raised 25 bp to 3.75%–4.00%, the first time in more than three years. At that moment BTC was digesting around 75k–76k. It didn’t break down; instead, it ran all the way to 87k.
The market stopped following the “rate hike must lead to a drop” script, and instead moved according to “risk appetite + ETF flows.” Falling oil prices, falling U.S. Treasury yields, and expectations for the U.S.–China summit—all helped compress the safe-haven premium, and risk assets broadly warmed up.
Third thing: the technicals tell you—don’t chase at 85.4k.
On September 21, a long bullish candle broke above the prior high at 82k–83k, and the high reached 87,400.
Today’s pullback to 85,400 is a normal retest after a breakout; the structure hasn’t been broken.
RSI at 69–73 is overbought, making chasing very poor in terms of risk-reward.
The MACD golden cross is still there, but after the expansion of the histogram, it tends to drift into digestion.
Resistance levels: 87,300–87,500 → 90,000 → 93,000
Support levels: 84,000 → 82,300–82,600 → 80,000–81,000 → 78,000
Trading strategy
For short-term traders:
Wait for a pullback to 84,000–82,600, then buy in batches after a low-volume stabilization and 4H lower wicks. Stop loss below 82,000. First target 87,000–87,400, second target 90,000.
For breakout chasing:
Only chase with a light position if the 1D or 4H closes firmly above 87,500 and the ETF continues net inflows. Targets 90k–93k.
For bearish/hedging:
88,600–87,400 is repeatedly capped and price action lacks momentum/volume. Take a light-position pullback trade with targets 84k/82.6k. Stop loss if above 87,600.