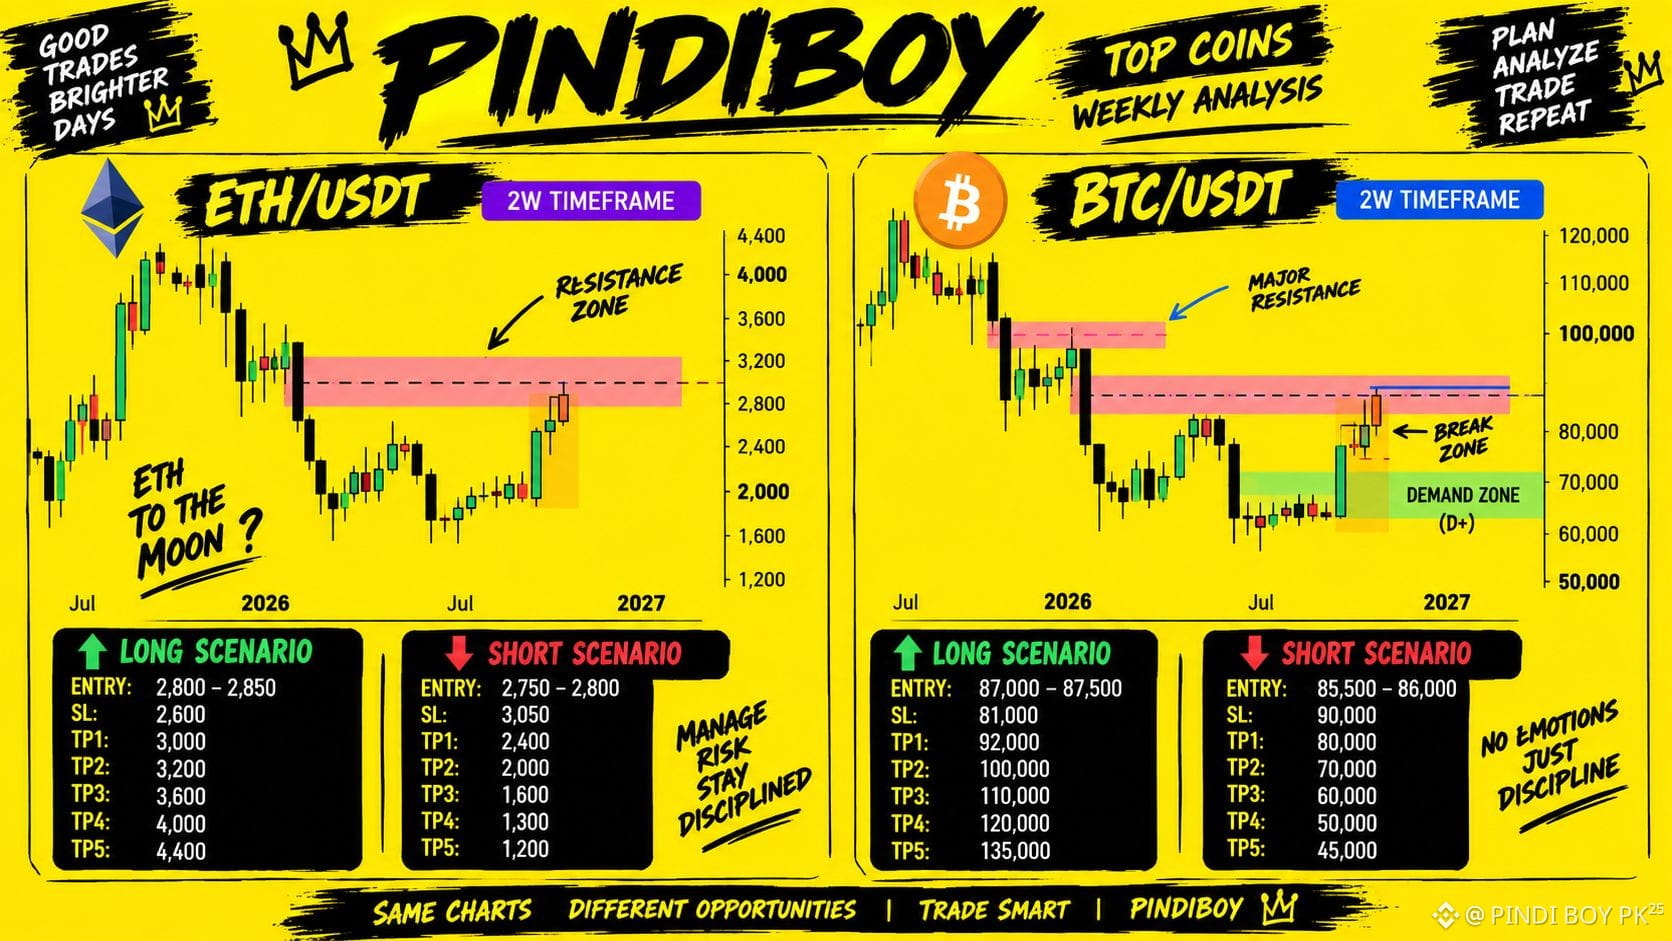

🟢 $BTC nd $ETH /USDT — 🟢LONG nd 🔴SHORT SCENARIO
TIMEFRAME: 2W
ENTRY: 87,000 – 87,500
STOP LOSS: 81,000
TP1: 92,000
TP2: 100,000
TP3: 110,000
TP4: 120,000
TP5: 135,000
Analysis: BTC is trading just below a major resistance/break zone. If a 2W confirmation and hold happen above 87,500, these levels can be watched for upside continuation. Around 100K, major resistance may appear.
🔴 BTC/USDT — SHORT SCENARIO
TIMEFRAME: 2W
ENTRY: 85,500 – 86,000
STOP LOSS: 90,000
TP1: 80,000
TP2: 70,000
TP3: 60,000
TP4: 50,000
TP5: 45,000
Analysis: If BTC cannot reclaim the 87K–90K resistance zone and rejection is confirmed, then on the downside the first 80K and then the demand zone around 70K are important levels.
🟢 ETH/USDT — LONG SCENARIO
TIMEFRAME: 2W
ENTRY: 2,800 – 2,850
STOP LOSS: 2,600
TP1: 3,000
TP2: 3,200
TP3: 3,600
TP4: 4,000
TP5: 4,400
Analysis: ETH is approaching the lower edge of its resistance zone. If you get a strong 2W breakout/hold above 2,850, then after 3K, 3.2K and 3.6K and higher resistance levels can become target areas.
🔴 ETH/USDT — SHORT SCENARIO
TIMEFRAME: 2W
ENTRY: 2,750 – 2,800
STOP LOSS: 3,050
TP1: 2,400
TP2: 2,000
TP3: 1,600
TP4: 1,300
TP5: 1,200
Analysis: If ETH rejects from the 2,800–2,850 resistance zone and weakness is confirmed below 2,750, then on the downside 2,400 and 2,000 are key levels. Further breakdown could open lower support zones.
KEY LEVELS
BTC: 87.5K = breakout confirmation | 85.5K–86K = rejection area
ETH: 2.85K = breakout confirmation | 2.75K–2.8K = rejection area
Important: These are chart-based conditional scenarios. It’s essential to wait for breakout/rejection confirmation before entering.
TIMEFRAME: 2W
ENTRY: 87,000 – 87,500
STOP LOSS: 81,000
TP1: 92,000
TP2: 100,000
TP3: 110,000
TP4: 120,000
TP5: 135,000
Analysis: BTC is trading just below a major resistance/break zone. If a 2W confirmation and hold happen above 87,500, these levels can be watched for upside continuation. Around 100K, major resistance may appear.
🔴 BTC/USDT — SHORT SCENARIO
TIMEFRAME: 2W
ENTRY: 85,500 – 86,000
STOP LOSS: 90,000
TP1: 80,000
TP2: 70,000
TP3: 60,000
TP4: 50,000
TP5: 45,000
Analysis: If BTC cannot reclaim the 87K–90K resistance zone and rejection is confirmed, then on the downside the first 80K and then the demand zone around 70K are important levels.
🟢 ETH/USDT — LONG SCENARIO
TIMEFRAME: 2W
ENTRY: 2,800 – 2,850
STOP LOSS: 2,600
TP1: 3,000
TP2: 3,200
TP3: 3,600
TP4: 4,000
TP5: 4,400
Analysis: ETH is approaching the lower edge of its resistance zone. If you get a strong 2W breakout/hold above 2,850, then after 3K, 3.2K and 3.6K and higher resistance levels can become target areas.
🔴 ETH/USDT — SHORT SCENARIO
TIMEFRAME: 2W
ENTRY: 2,750 – 2,800
STOP LOSS: 3,050
TP1: 2,400
TP2: 2,000
TP3: 1,600
TP4: 1,300
TP5: 1,200
Analysis: If ETH rejects from the 2,800–2,850 resistance zone and weakness is confirmed below 2,750, then on the downside 2,400 and 2,000 are key levels. Further breakdown could open lower support zones.
KEY LEVELS
BTC: 87.5K = breakout confirmation | 85.5K–86K = rejection area
ETH: 2.85K = breakout confirmation | 2.75K–2.8K = rejection area
Important: These are chart-based conditional scenarios. It’s essential to wait for breakout/rejection confirmation before entering.