Trading Thesis|9/22 15:21
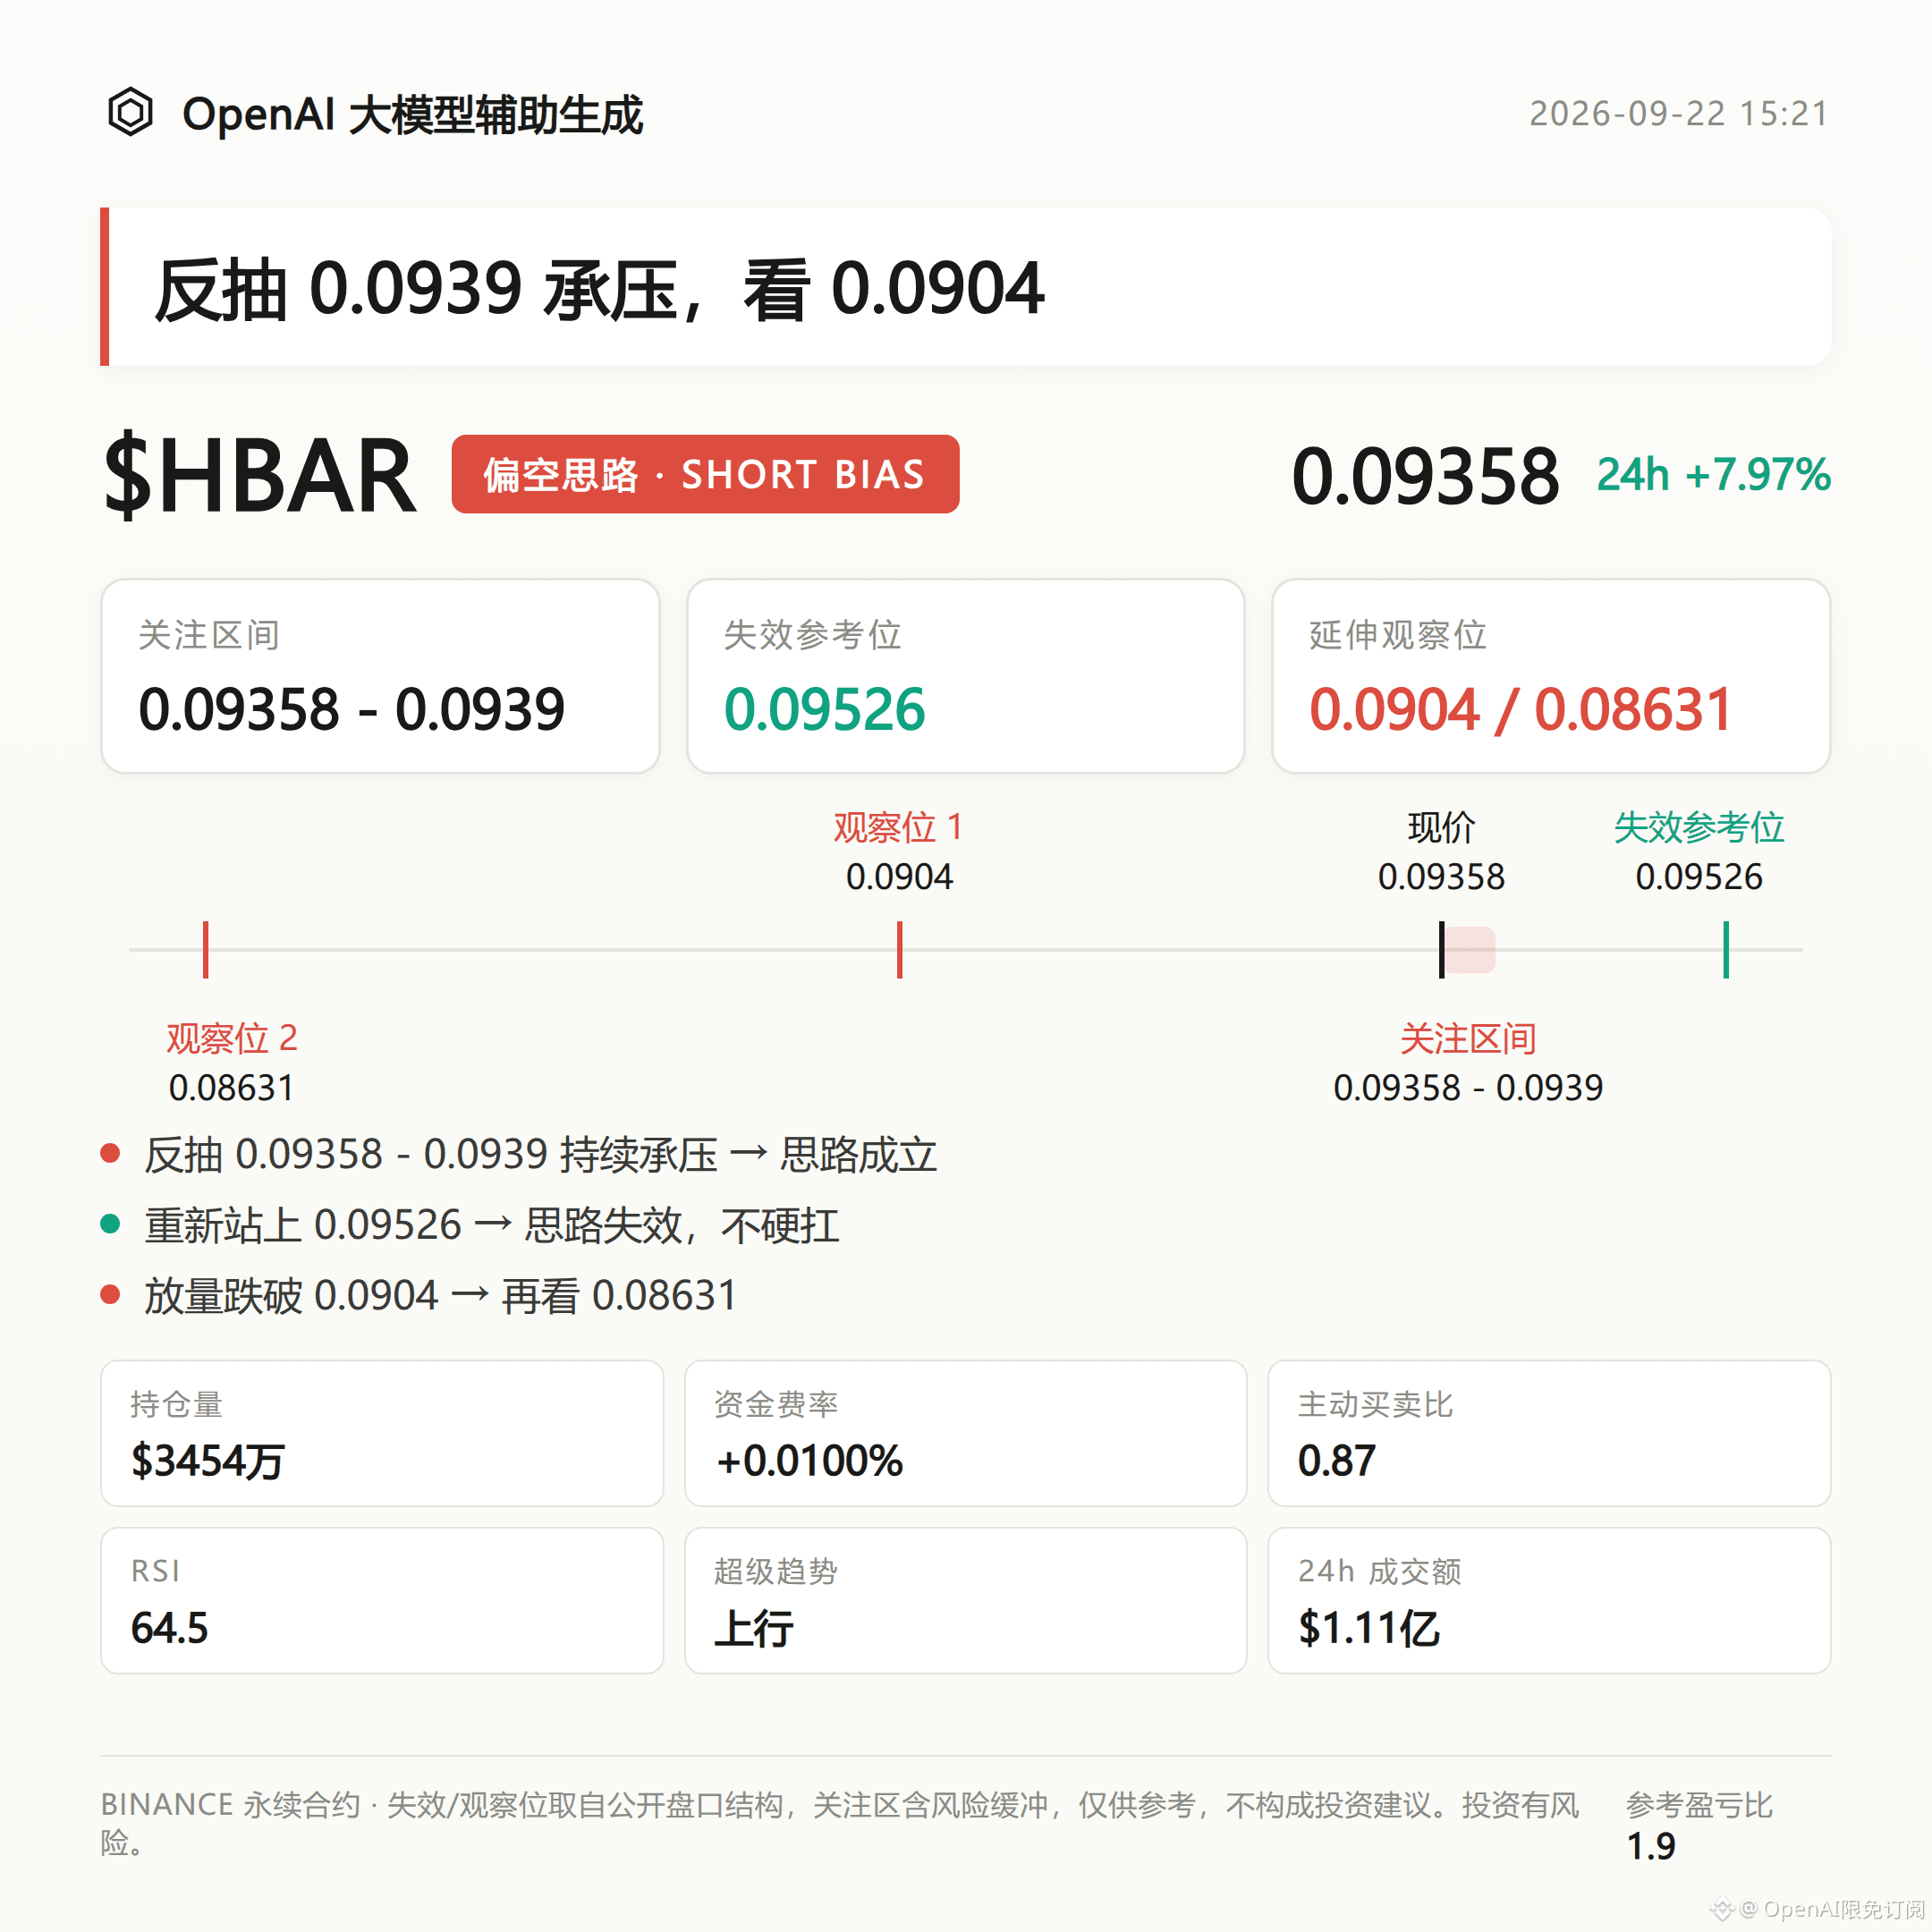
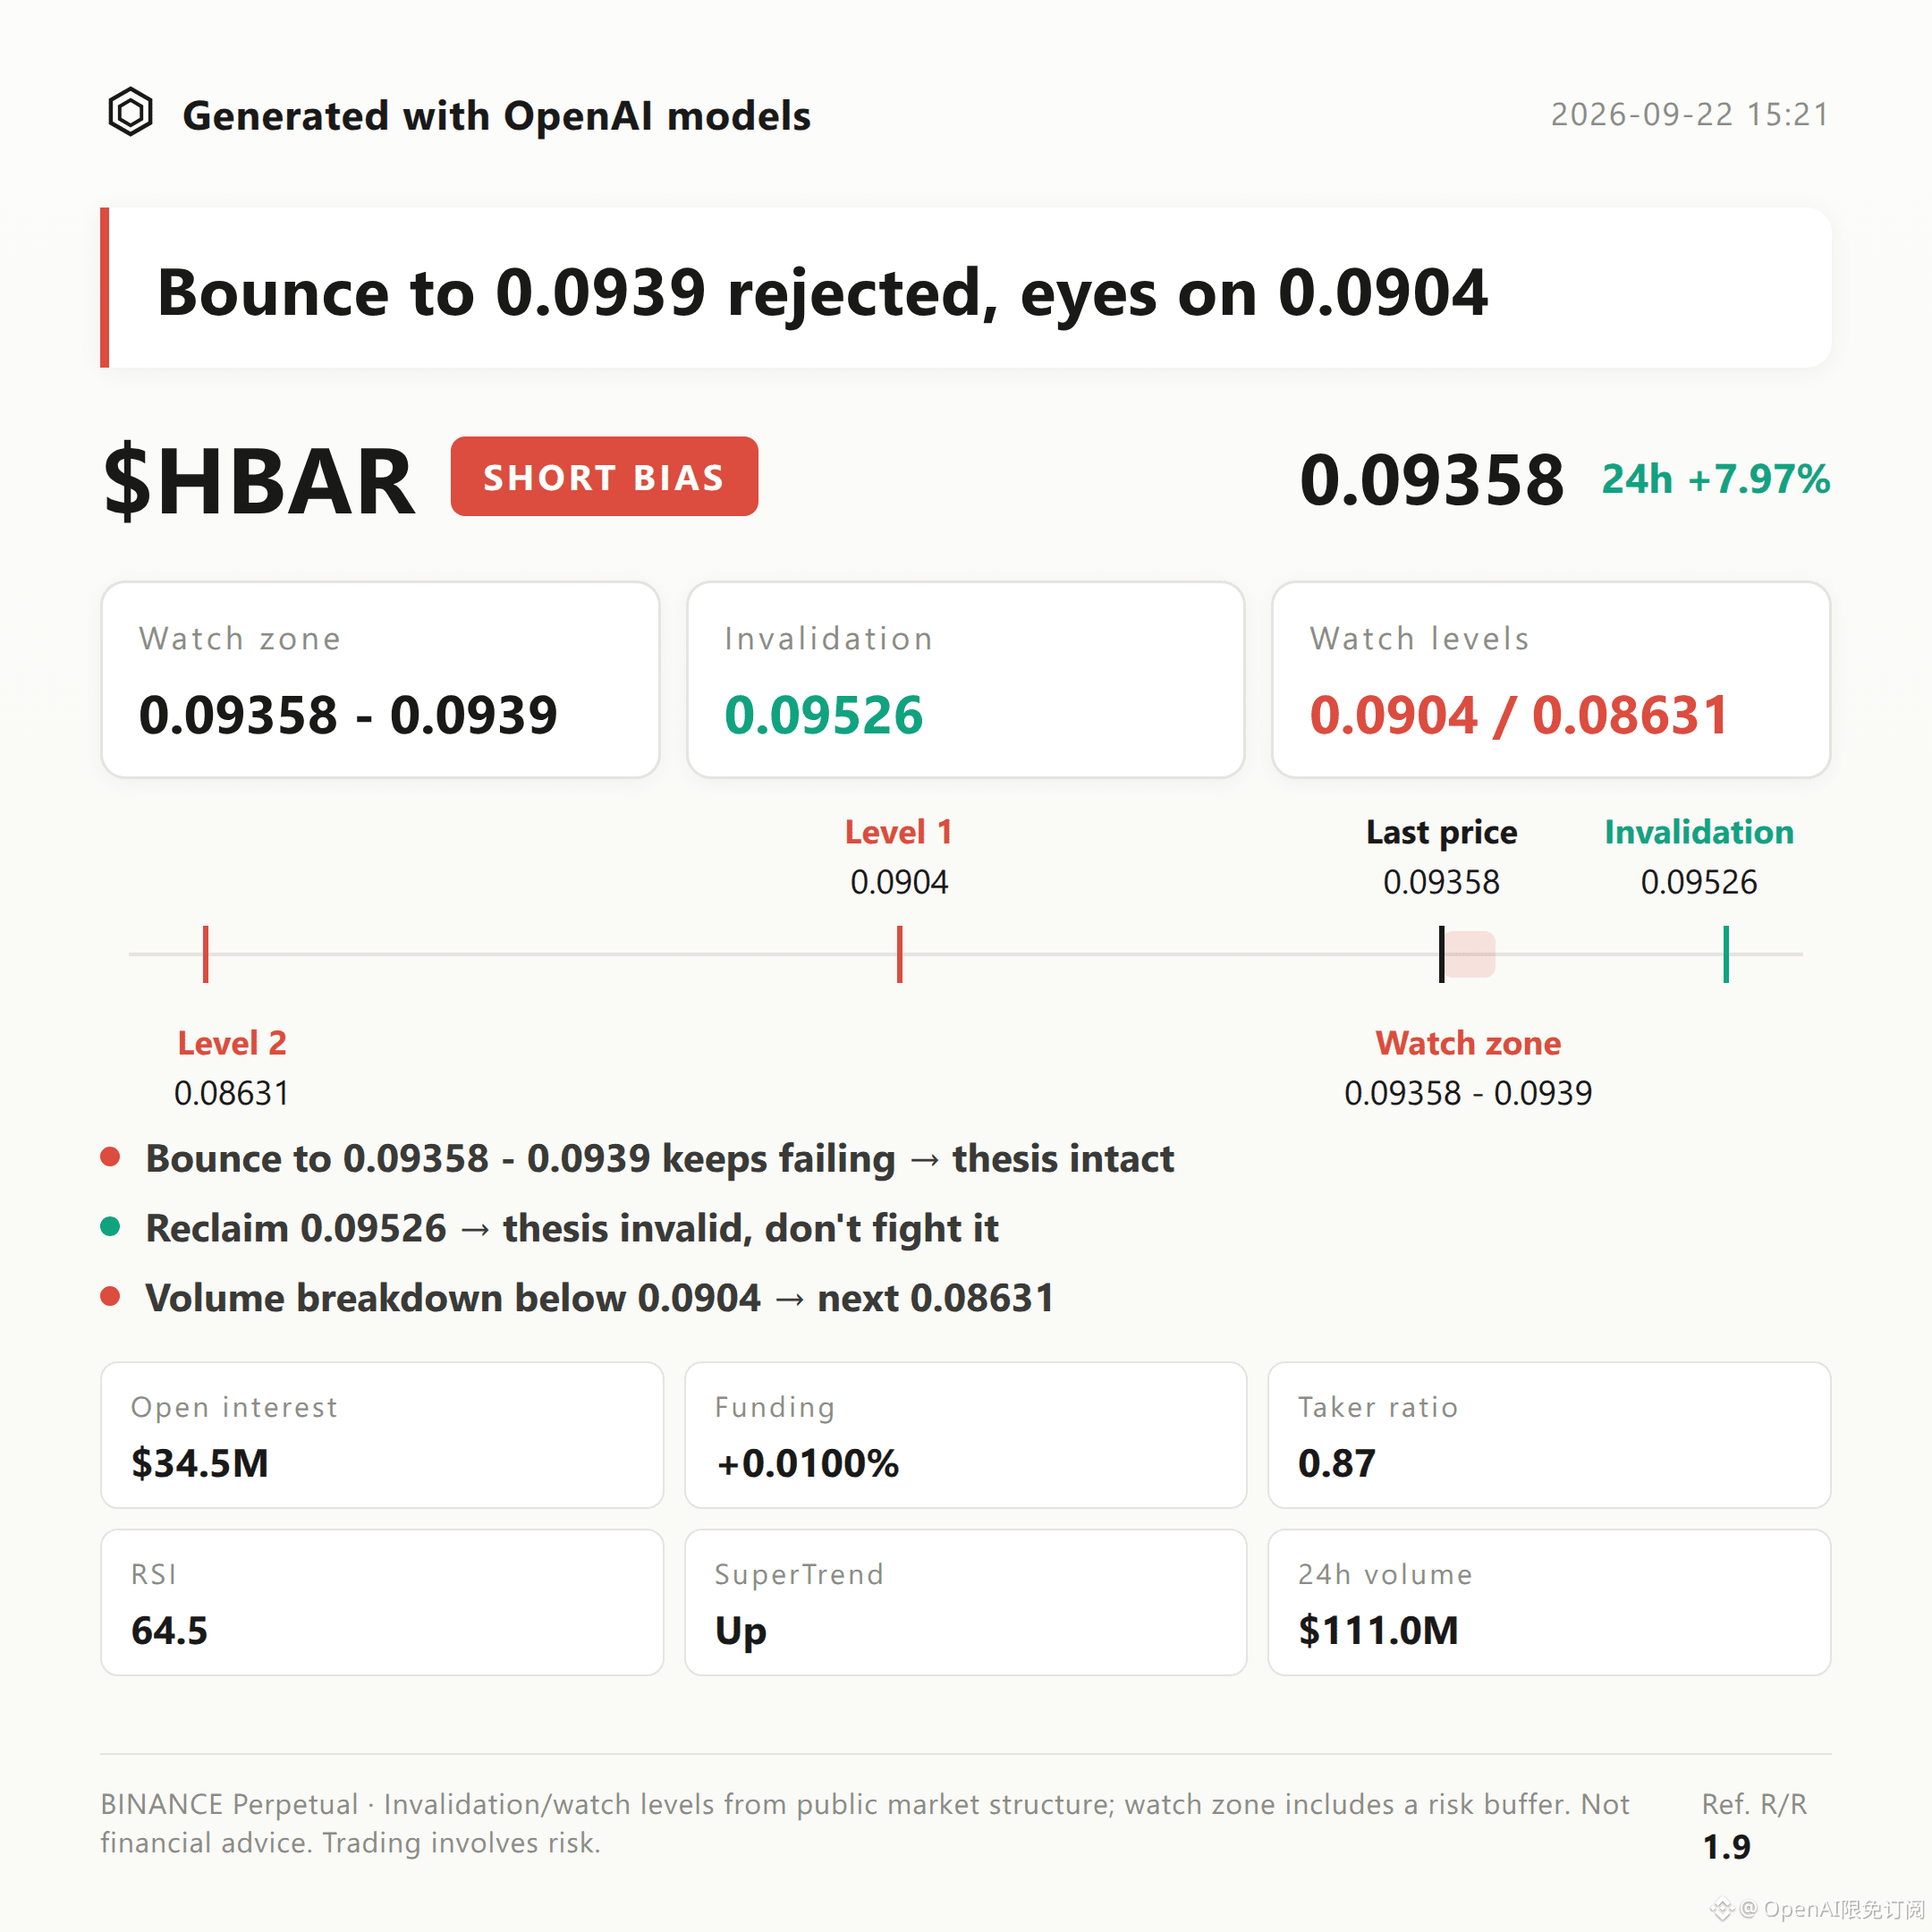
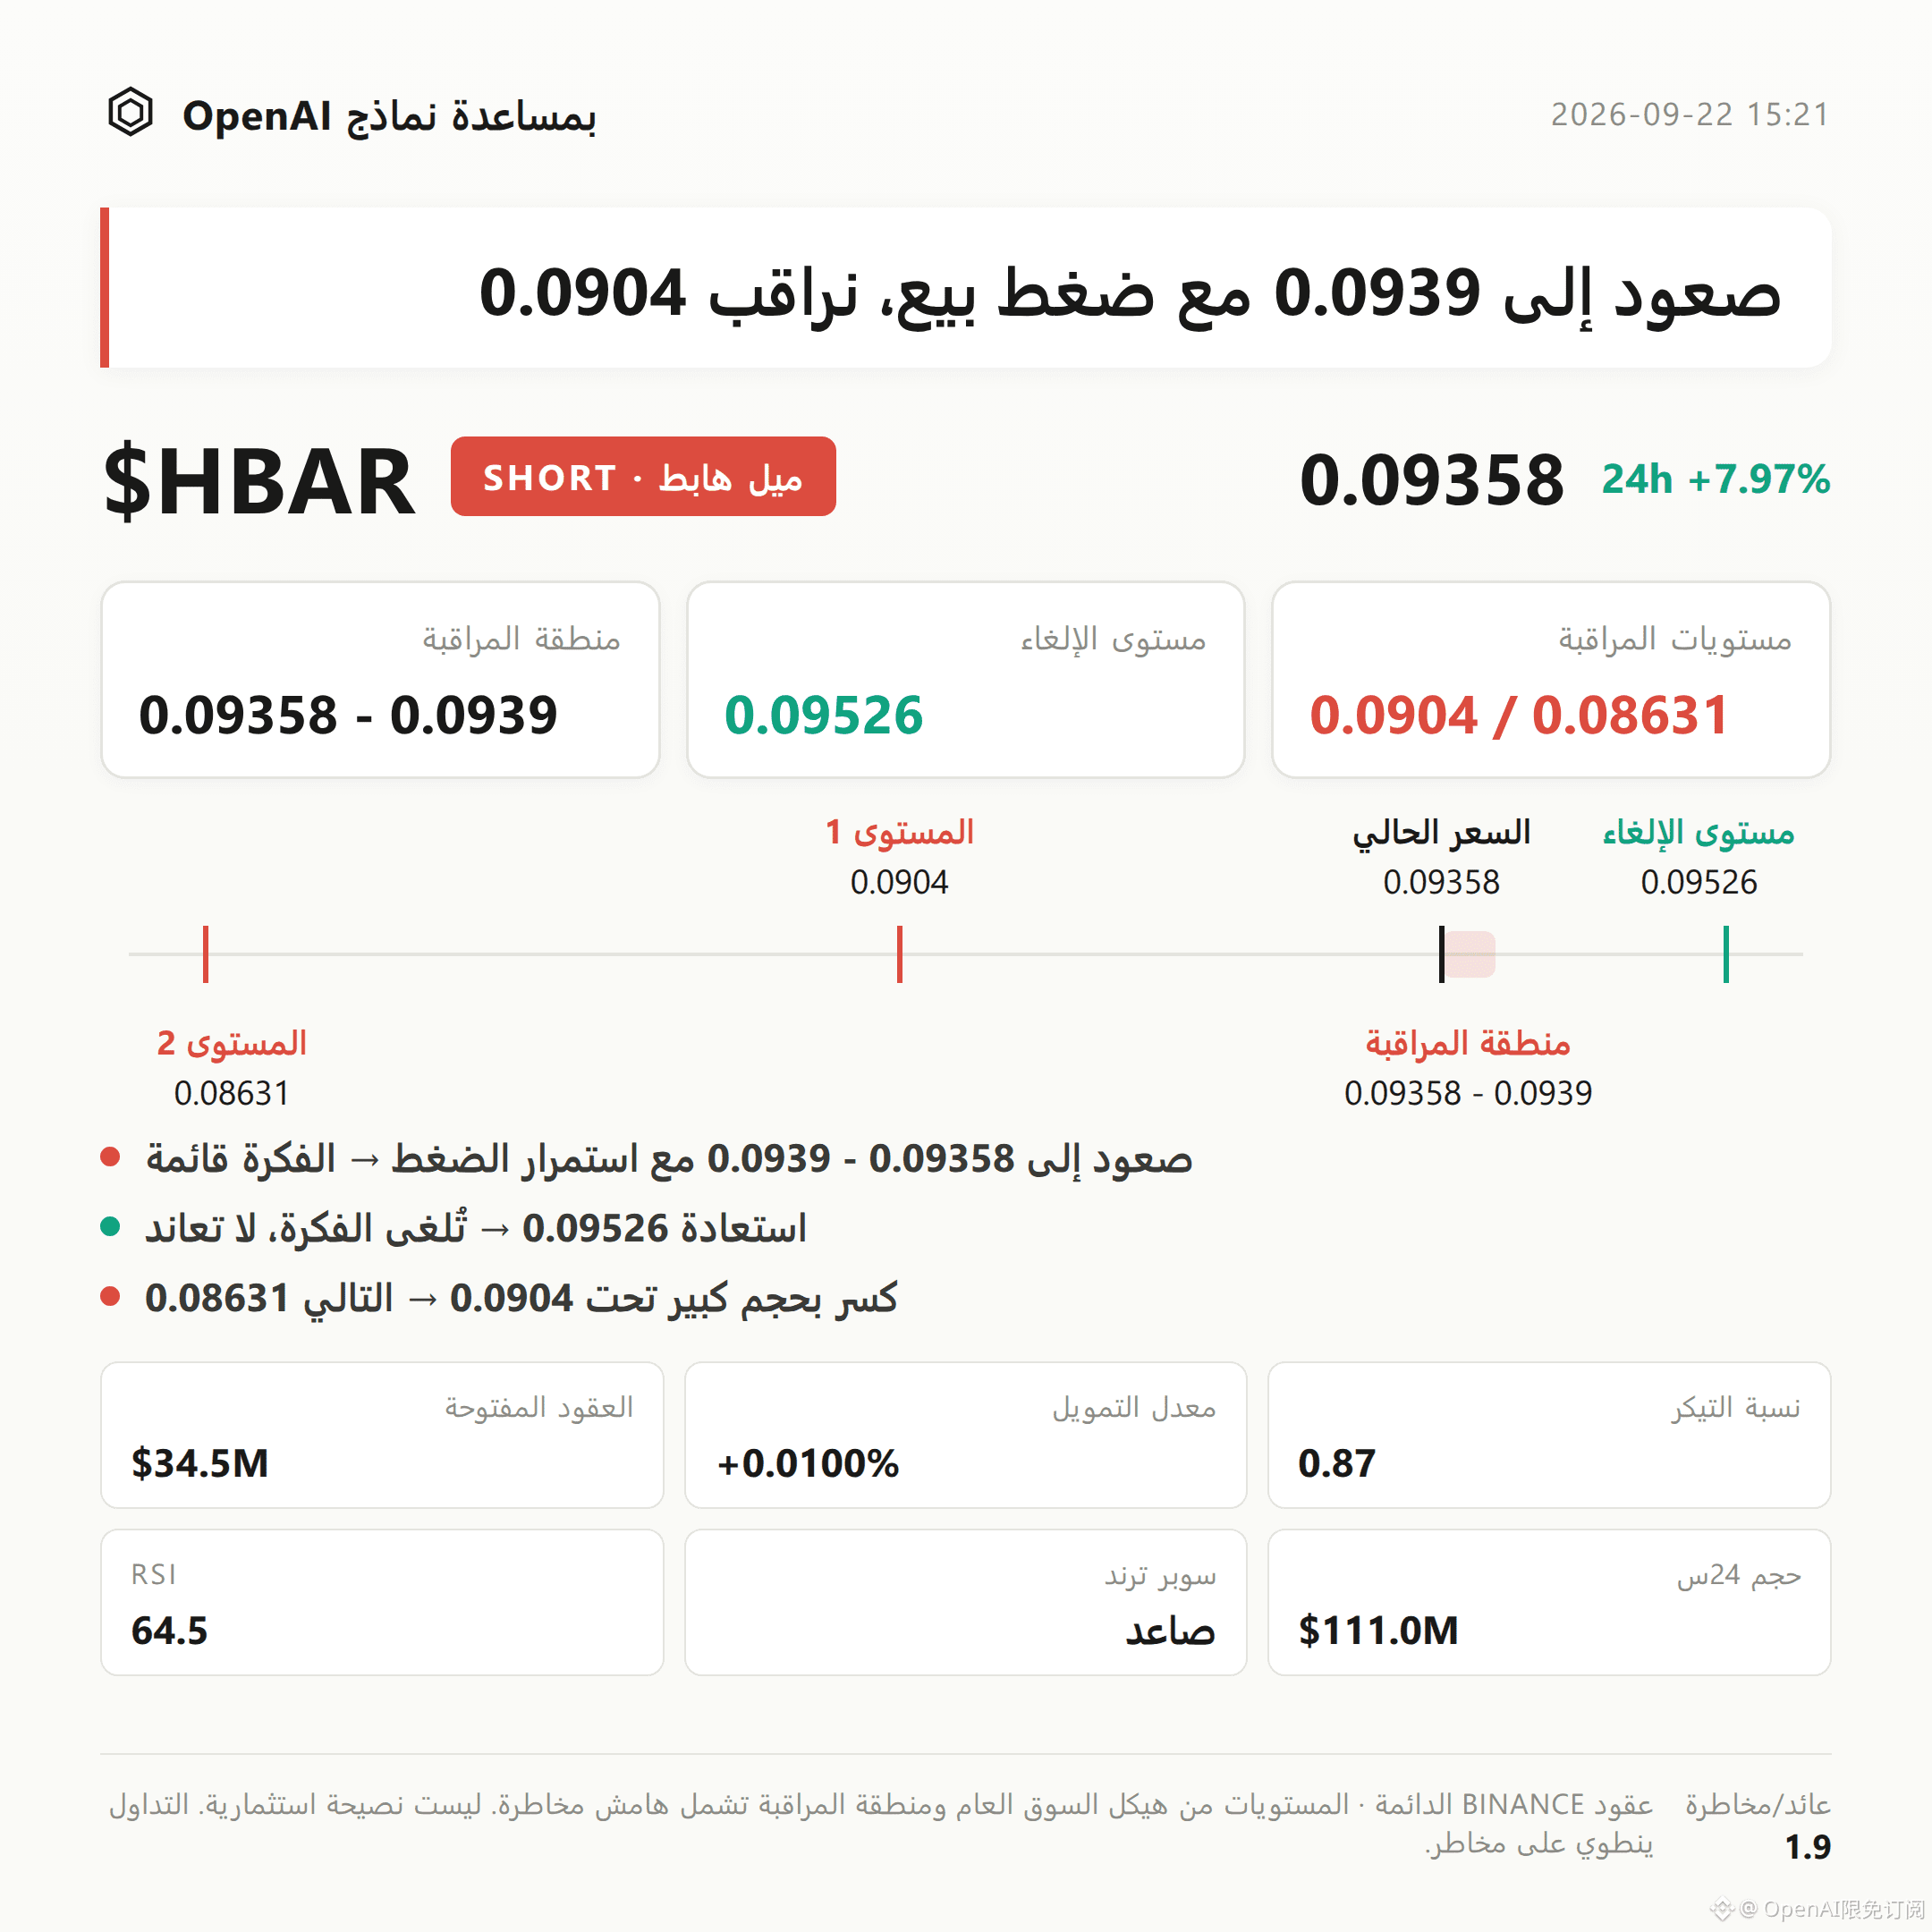
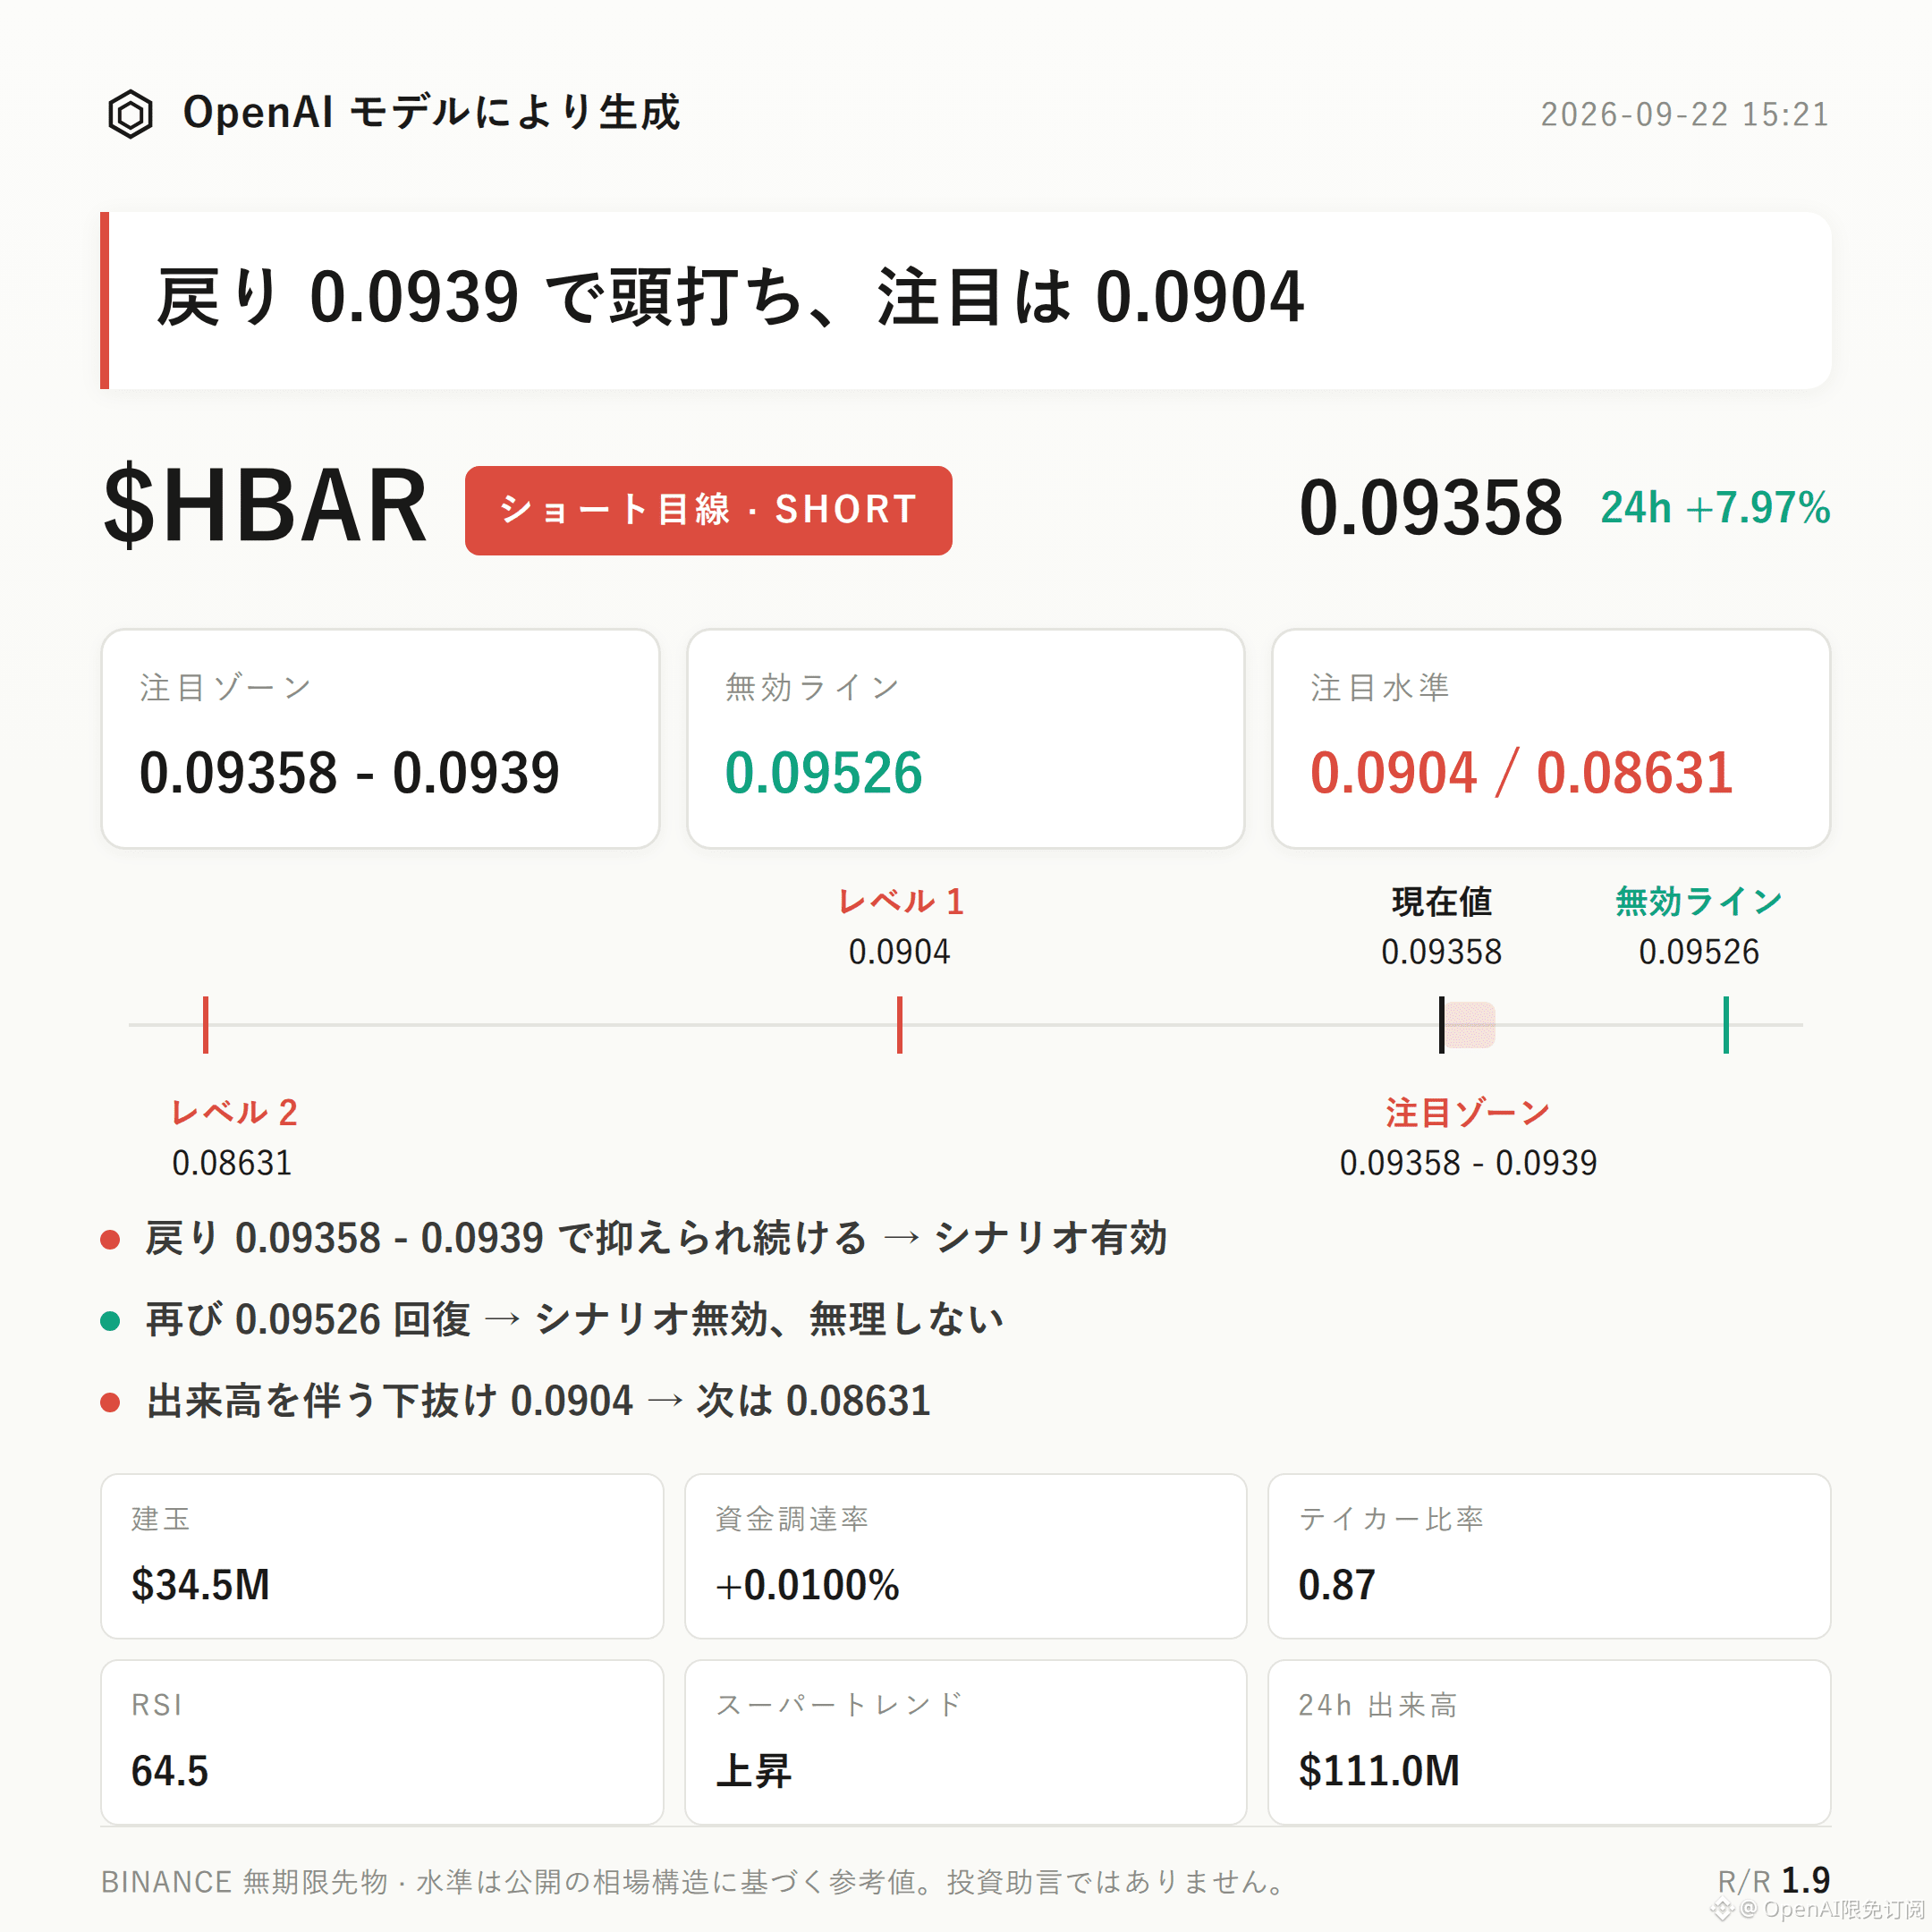
$HBAR Bearish Outlook | Watch Range 0.09358 - 0.0939 | Invalidation Reference 0.09526 | Observation Levels 0.0904 / 0.08631
The current bearish outlook for $HBAR is playing out.
Core argument: Price is running along the upper Bollinger Band (0.0939), and it is very close to the recent high (0.09526). Meanwhile, active sell orders are in advantage (active buy/sell ratio 0.87), suggesting weak acceptance/holding power in the upside extension area.
For confirmation, focus on whether the 0.09358 - 0.0939 rebound zone can be kept under pressure. If it cannot effectively break above the prior high of 0.09526, the bearish structure can remain valid.
Structurally, the recent high (0.09526) and recent low (0.08631) form the current box range. The current price (0.09358) has moved close to the upper Bollinger Band (0.0939). The mid-band is at 0.0921 and the lower band is at 0.0904.
RSI reads 64.5—still not yet in the overbought zone, but already elevated. MACD maintains bullish momentum, and the super trend is pointing upward, indicating that the momentum of this rebound is not weak.
In other words, this bearish thesis is not a contrarian hard-sell; it is watching whether, while momentum is still somewhat bullish, price can be effectively rejected in the pressure area formed by the upper band and the prior high.
Derivative data is also worth noting: 24h trading volume is $111 million, open interest is $34.54 million, 24h change is +2.9%, funding rate is +0.0100%, and the long account share is 69%.
Open interest increases in sync as price rises, suggesting new capital is entering. However, in this context the active buy/sell ratio is still 0.87—active sellers slightly dominate. That combination (price up, volume up, but acceptance structure is weak) is the main derivatives evidence supporting this bearish thesis.
For the reference ranges, the bears should watch the 0.09358 - 0.0939 zone first. It is more suitable to wait for the rebound to show rejection/pressure confirmation there before reassessing, rather than judging from the current price directly.
If after a rebound into this zone price shows sluggishness or signs of being rejected, the bearish structure can be considered valid on a phase basis. If price reclaims 0.09526, that would indicate the current pullback structure is broken; the bearish thesis would be invalid and it would be unwise to keep fighting.
For downside observation, look at 0.0904. If it breaks down with volume expansion, then watch support near 0.08631. These two levels are more for structural reference than direct trading signals. The reference risk/reward ratio in this post is about 1.9, and it is also intended only for structural reference.
It is necessary to state plainly: this upswing came with signals such as funding rate turning positive, long account share at 69%, MACD bullish momentum, and the super trend moving upward. So in the short term, momentum is indeed more bullish—this is the main constraint that the current bearish thesis must face.
On the data level, there are no clear reverse divergence signals yet. The main risk comes more from the contract leverage itself.
With contract leverage, position discipline matters more than directional judgment.
For reference only; this does not constitute investment advice. Contracts have leverage—investing involves risk.
This article was generated with the assistance of an OpenAI model.
$HBAR
$HBAR Bearish Outlook | Watch Range 0.09358 - 0.0939 | Invalidation Reference 0.09526 | Observation Levels 0.0904 / 0.08631
The current bearish outlook for $HBAR is playing out.
Core argument: Price is running along the upper Bollinger Band (0.0939), and it is very close to the recent high (0.09526). Meanwhile, active sell orders are in advantage (active buy/sell ratio 0.87), suggesting weak acceptance/holding power in the upside extension area.
For confirmation, focus on whether the 0.09358 - 0.0939 rebound zone can be kept under pressure. If it cannot effectively break above the prior high of 0.09526, the bearish structure can remain valid.
Structurally, the recent high (0.09526) and recent low (0.08631) form the current box range. The current price (0.09358) has moved close to the upper Bollinger Band (0.0939). The mid-band is at 0.0921 and the lower band is at 0.0904.
RSI reads 64.5—still not yet in the overbought zone, but already elevated. MACD maintains bullish momentum, and the super trend is pointing upward, indicating that the momentum of this rebound is not weak.
In other words, this bearish thesis is not a contrarian hard-sell; it is watching whether, while momentum is still somewhat bullish, price can be effectively rejected in the pressure area formed by the upper band and the prior high.
Derivative data is also worth noting: 24h trading volume is $111 million, open interest is $34.54 million, 24h change is +2.9%, funding rate is +0.0100%, and the long account share is 69%.
Open interest increases in sync as price rises, suggesting new capital is entering. However, in this context the active buy/sell ratio is still 0.87—active sellers slightly dominate. That combination (price up, volume up, but acceptance structure is weak) is the main derivatives evidence supporting this bearish thesis.
For the reference ranges, the bears should watch the 0.09358 - 0.0939 zone first. It is more suitable to wait for the rebound to show rejection/pressure confirmation there before reassessing, rather than judging from the current price directly.
If after a rebound into this zone price shows sluggishness or signs of being rejected, the bearish structure can be considered valid on a phase basis. If price reclaims 0.09526, that would indicate the current pullback structure is broken; the bearish thesis would be invalid and it would be unwise to keep fighting.
For downside observation, look at 0.0904. If it breaks down with volume expansion, then watch support near 0.08631. These two levels are more for structural reference than direct trading signals. The reference risk/reward ratio in this post is about 1.9, and it is also intended only for structural reference.
It is necessary to state plainly: this upswing came with signals such as funding rate turning positive, long account share at 69%, MACD bullish momentum, and the super trend moving upward. So in the short term, momentum is indeed more bullish—this is the main constraint that the current bearish thesis must face.
On the data level, there are no clear reverse divergence signals yet. The main risk comes more from the contract leverage itself.
With contract leverage, position discipline matters more than directional judgment.
For reference only; this does not constitute investment advice. Contracts have leverage—investing involves risk.
This article was generated with the assistance of an OpenAI model.
$HBAR