🚀BITCOIN TO THE MOON? $BTC 86,000 BREAKOUT + RSI & MACD ALIGNMENT! 🔥
Is it really the end of Crypto Winter for everyone? Or is this just a bull trap? 🤔
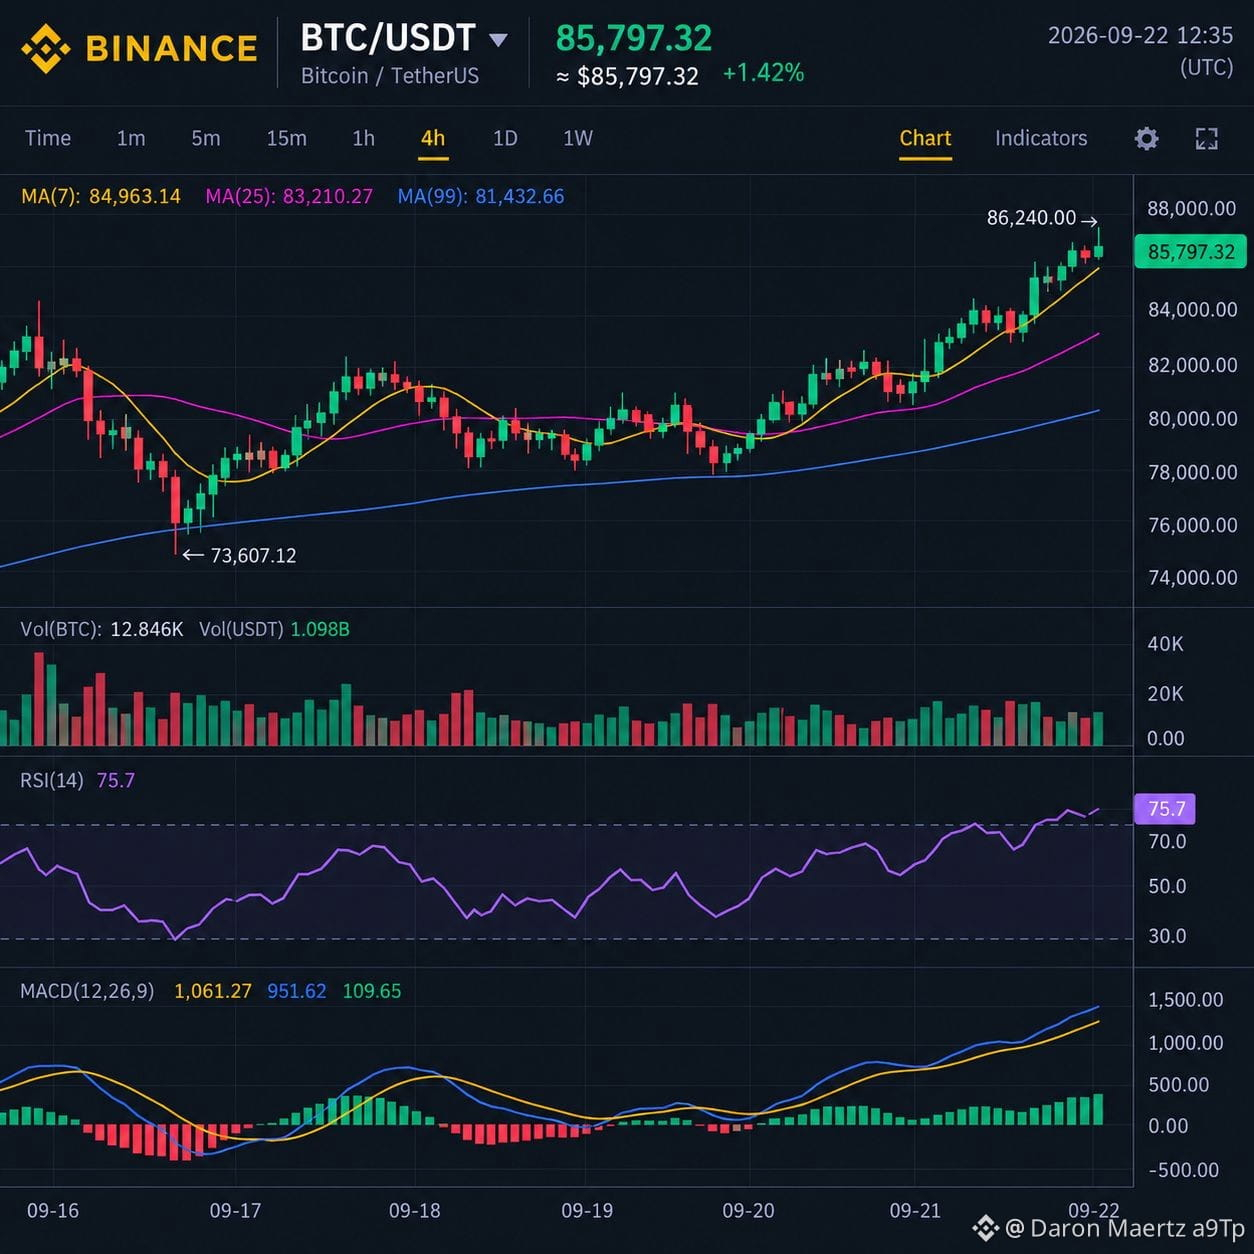
Friends, Bitcoin has broken through the highest level of the last 8 months—an 8-month high at $BTC 86,000. Right now, more than $648M worth of shorts have already been liquidated in the market. But before placing a trade, let’s see what the indicators are saying:
📊 Technical Analysis (RSI & MACD Update):
RSI (Relative Strength Index): On the daily chart, RSI is currently in the 72–74 zone (overbought). This shows that buying momentum is very strong, but at the same time, a short-term cooldown or minor profit-taking correction may also come.
MACD (Moving Average Convergence Divergence): The MACD line has formed a strong bullish crossover above the signal line. At the same time, the histogram bars are continuously turning green, confirming that buyers fully control the market and the trend is currently building upward momentum.
📈 Key Levels to Watch:
Current Price: ~$85,600
Target/Resistance: The next major resistance target is straight at $89,800.
Support Zone: In case of a pullback, $81,200 and $76,500 will act as strong support.
💡 Expert Strategy:
The indicators clearly suggest momentum is very bullish, but don’t fall into blind FOMO because RSI is overbought. The smarter strategy is to wait for small pullbacks instead of buying directly at the top—and always trade with a Stop-Loss!
👇 What’s your plan? Are you going long at this level or short? Share your technical view in the comments below!
#BTC☀️ #RSI #MACD #BinanceSquare
$BTC
Is it really the end of Crypto Winter for everyone? Or is this just a bull trap? 🤔
Friends, Bitcoin has broken through the highest level of the last 8 months—an 8-month high at $BTC 86,000. Right now, more than $648M worth of shorts have already been liquidated in the market. But before placing a trade, let’s see what the indicators are saying:
📊 Technical Analysis (RSI & MACD Update):
RSI (Relative Strength Index): On the daily chart, RSI is currently in the 72–74 zone (overbought). This shows that buying momentum is very strong, but at the same time, a short-term cooldown or minor profit-taking correction may also come.
MACD (Moving Average Convergence Divergence): The MACD line has formed a strong bullish crossover above the signal line. At the same time, the histogram bars are continuously turning green, confirming that buyers fully control the market and the trend is currently building upward momentum.
📈 Key Levels to Watch:
Current Price: ~$85,600
Target/Resistance: The next major resistance target is straight at $89,800.
Support Zone: In case of a pullback, $81,200 and $76,500 will act as strong support.
💡 Expert Strategy:
The indicators clearly suggest momentum is very bullish, but don’t fall into blind FOMO because RSI is overbought. The smarter strategy is to wait for small pullbacks instead of buying directly at the top—and always trade with a Stop-Loss!
👇 What’s your plan? Are you going long at this level or short? Share your technical view in the comments below!
#BTC☀️ #RSI #MACD #BinanceSquare
$BTC