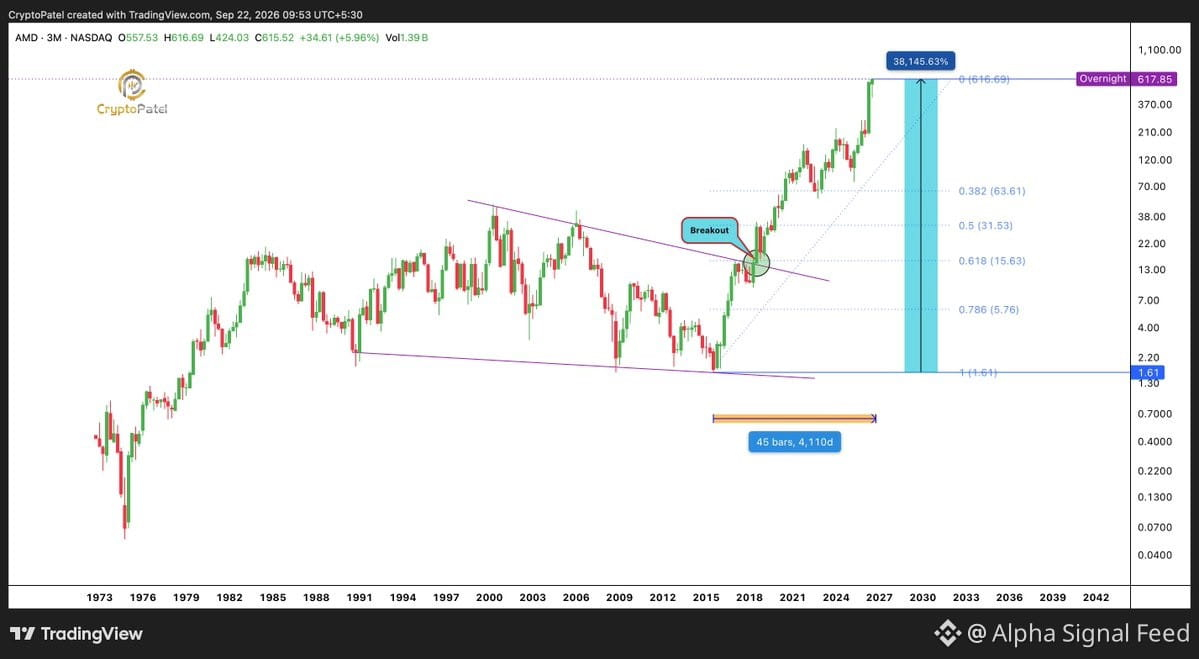
$AMD just printed a 38,200% run from $1.61 (July 2015) to ~$616 today.
$1k → $382k. 382x.
But here's the macro setup that's got me watching:
• Multi-year uptrend intact after breaking descending resistance
• Zero major retracement to 0.382 or 0.5 Fib since 2015 bottom
• Parabolic structures historically don't end well without deep corrections
I'm not calling the top. I'm not saying crash incoming.
But if we get a macro retracement cycle (could take 5-7+ years), the $60-$30 zone becomes a long-term accumulation watch.
The higher this goes without breathing, the nastier the eventual pullback.
Strategy: Let price structure confirm. Don't try to call the exact ATH.
NFA. DYOR.
$1k → $382k. 382x.
But here's the macro setup that's got me watching:
• Multi-year uptrend intact after breaking descending resistance
• Zero major retracement to 0.382 or 0.5 Fib since 2015 bottom
• Parabolic structures historically don't end well without deep corrections
I'm not calling the top. I'm not saying crash incoming.
But if we get a macro retracement cycle (could take 5-7+ years), the $60-$30 zone becomes a long-term accumulation watch.
The higher this goes without breathing, the nastier the eventual pullback.
Strategy: Let price structure confirm. Don't try to call the exact ATH.
NFA. DYOR.