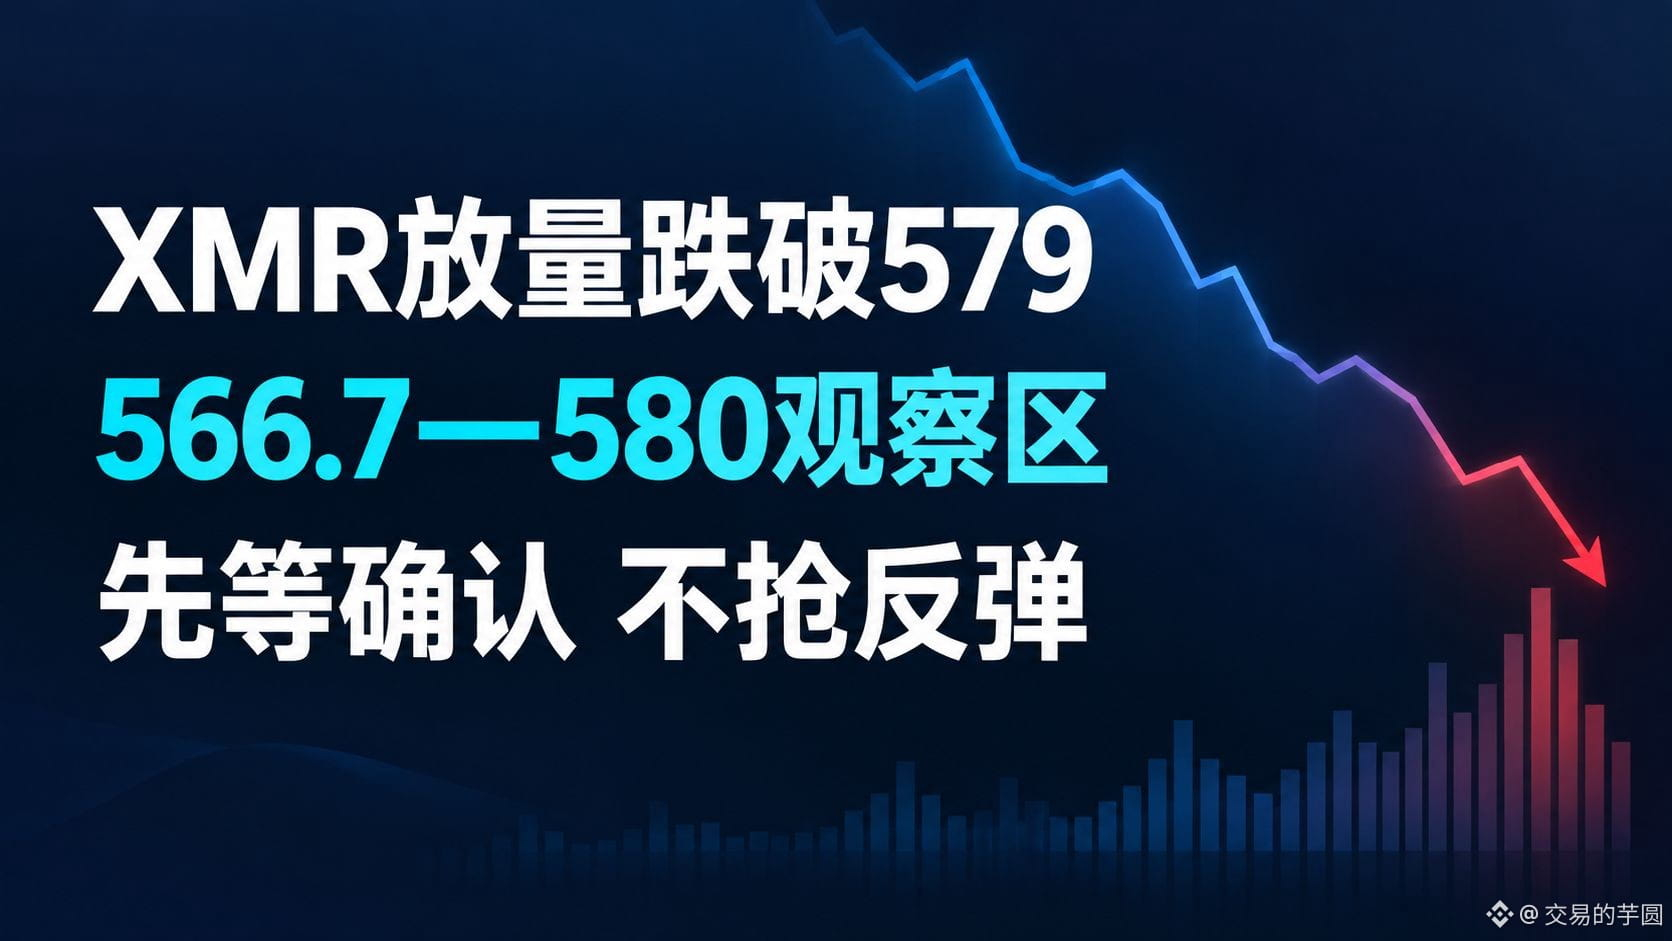
XMR breaks below 579 with a surge in volume; open positions decline in sync: I’ll wait to confirm on both sides of 566 and 580
My stance is defensive—I don’t treat this single sharp selloff as an automatic buy-the-dip signal, and I also won’t chase a short after the lower wick. Binance Plaza Trending Topics and the six-hour Most Searched don’t map to any precise XMR topic. I checked Binance News, Research, and OTC, the official Monero website and official code releases, as well as central bank/regulatory, ETF, and corporate holdings channels, and I couldn’t find any verifiable new protocol upgrade or security notice that directly explains the big XMR bearish candle just now. The Monero official repository shows software versions that clearly were not “released only at this moment.” THORChain previously wrote about the future integration sequence for XMR, but there’s no new mainnet launch fact. Therefore, this piece doesn’t claim that an old piece of news caused the plunge; it only makes limited judgments based on publicly available price action and changes in leverage.
KuCoin’s publicly available latest XMRUSDTM contract trades are around $573. The 24-hour high/low is 635.44 and 551.39. The full 15-minute candle at 11:00 Beijing time opened at 583.29, with the high also 583.29, the low at 566.70, and closed at 574.87, with about 139,200 lots traded; the previous candle had only 6,895 lots. Then the next candle bounced to 577.90 and closed at 577.41, with about 24,800 lots. After that, price returned to around 574, and the rebound volume was far smaller than the selloff volume. The contract funding rate is roughly positive at 0.0343%, with open interest around 7.84 million lots. At an estimated 0.01 XMR per lot, that’s about 78,400 coins, or a notional value of roughly $44.9 million. A previous post at 10:02 showed open interest around 8.2 million lots and funding rate positive at 0.0779%; now both have fallen, which suggests leverage “heat” is cooling. However, aggregated public data can’t identify whether each trade was主动平多 (actively closing longs),平空 (closing shorts), or forced liquidations, and it also can’t prove that any institution dumped.
The old plan required that two 15-minute candles from 579–583 hold/contain, with a strong close back above 590, and only then—if the next candle guards above 587—would I consider going long. Price first probed down to 566.70, then failed to return to 590, so the entry conditions never appeared. I didn’t execute that hypothetical trade, and I have no declarable profit. New near-term support is 571–573. If it breaks down and the subsequent rebound can’t reclaim, then we look at 566.7. Resistance is first at 577–580; above that is 583–586. Simply standing back above 575 within one minute isn’t enough to overturn a weak bias—we need to at least see the full candlestick structure and volume. If price instead closes back above 583 on volume and then retraces to 580 without breaking it, that weaker view would need to be reassessed.
If I were trading this myself, I’m currently participating with 0; my stance is neutral-to-bearish, and I won’t use leverage at this stage. Only if there are two consecutive 15-minute candles in the 566.7–572 range that do not set new lows, and then the market puts out volume and closes up above 578.5, with the next candle holding above 576, would I use at most 0.8% of trading capital to test a long in spot. Targets would be 583–586 and 590–593, with the first target taking half off. After entry, if price falls back to 572, I’ll cut half; if a 15-minute candle closes below 566.5, I’ll close the remaining position. If price breaks below 566.7 and the rebound fails to recover to 574, the long entry plan is canceled—I’ll stay in cash (no position) and wait for structure to rebuild. Protecting capital matters more than guessing the lowest price.
$XMR
The above is only my personal market observation and does not constitute investment advice.
My stance is defensive—I don’t treat this single sharp selloff as an automatic buy-the-dip signal, and I also won’t chase a short after the lower wick. Binance Plaza Trending Topics and the six-hour Most Searched don’t map to any precise XMR topic. I checked Binance News, Research, and OTC, the official Monero website and official code releases, as well as central bank/regulatory, ETF, and corporate holdings channels, and I couldn’t find any verifiable new protocol upgrade or security notice that directly explains the big XMR bearish candle just now. The Monero official repository shows software versions that clearly were not “released only at this moment.” THORChain previously wrote about the future integration sequence for XMR, but there’s no new mainnet launch fact. Therefore, this piece doesn’t claim that an old piece of news caused the plunge; it only makes limited judgments based on publicly available price action and changes in leverage.
KuCoin’s publicly available latest XMRUSDTM contract trades are around $573. The 24-hour high/low is 635.44 and 551.39. The full 15-minute candle at 11:00 Beijing time opened at 583.29, with the high also 583.29, the low at 566.70, and closed at 574.87, with about 139,200 lots traded; the previous candle had only 6,895 lots. Then the next candle bounced to 577.90 and closed at 577.41, with about 24,800 lots. After that, price returned to around 574, and the rebound volume was far smaller than the selloff volume. The contract funding rate is roughly positive at 0.0343%, with open interest around 7.84 million lots. At an estimated 0.01 XMR per lot, that’s about 78,400 coins, or a notional value of roughly $44.9 million. A previous post at 10:02 showed open interest around 8.2 million lots and funding rate positive at 0.0779%; now both have fallen, which suggests leverage “heat” is cooling. However, aggregated public data can’t identify whether each trade was主动平多 (actively closing longs),平空 (closing shorts), or forced liquidations, and it also can’t prove that any institution dumped.
The old plan required that two 15-minute candles from 579–583 hold/contain, with a strong close back above 590, and only then—if the next candle guards above 587—would I consider going long. Price first probed down to 566.70, then failed to return to 590, so the entry conditions never appeared. I didn’t execute that hypothetical trade, and I have no declarable profit. New near-term support is 571–573. If it breaks down and the subsequent rebound can’t reclaim, then we look at 566.7. Resistance is first at 577–580; above that is 583–586. Simply standing back above 575 within one minute isn’t enough to overturn a weak bias—we need to at least see the full candlestick structure and volume. If price instead closes back above 583 on volume and then retraces to 580 without breaking it, that weaker view would need to be reassessed.
If I were trading this myself, I’m currently participating with 0; my stance is neutral-to-bearish, and I won’t use leverage at this stage. Only if there are two consecutive 15-minute candles in the 566.7–572 range that do not set new lows, and then the market puts out volume and closes up above 578.5, with the next candle holding above 576, would I use at most 0.8% of trading capital to test a long in spot. Targets would be 583–586 and 590–593, with the first target taking half off. After entry, if price falls back to 572, I’ll cut half; if a 15-minute candle closes below 566.5, I’ll close the remaining position. If price breaks below 566.7 and the rebound fails to recover to 574, the long entry plan is canceled—I’ll stay in cash (no position) and wait for structure to rebuild. Protecting capital matters more than guessing the lowest price.
$XMR
The above is only my personal market observation and does not constitute investment advice.