Trading Thesis|9/22 10:21
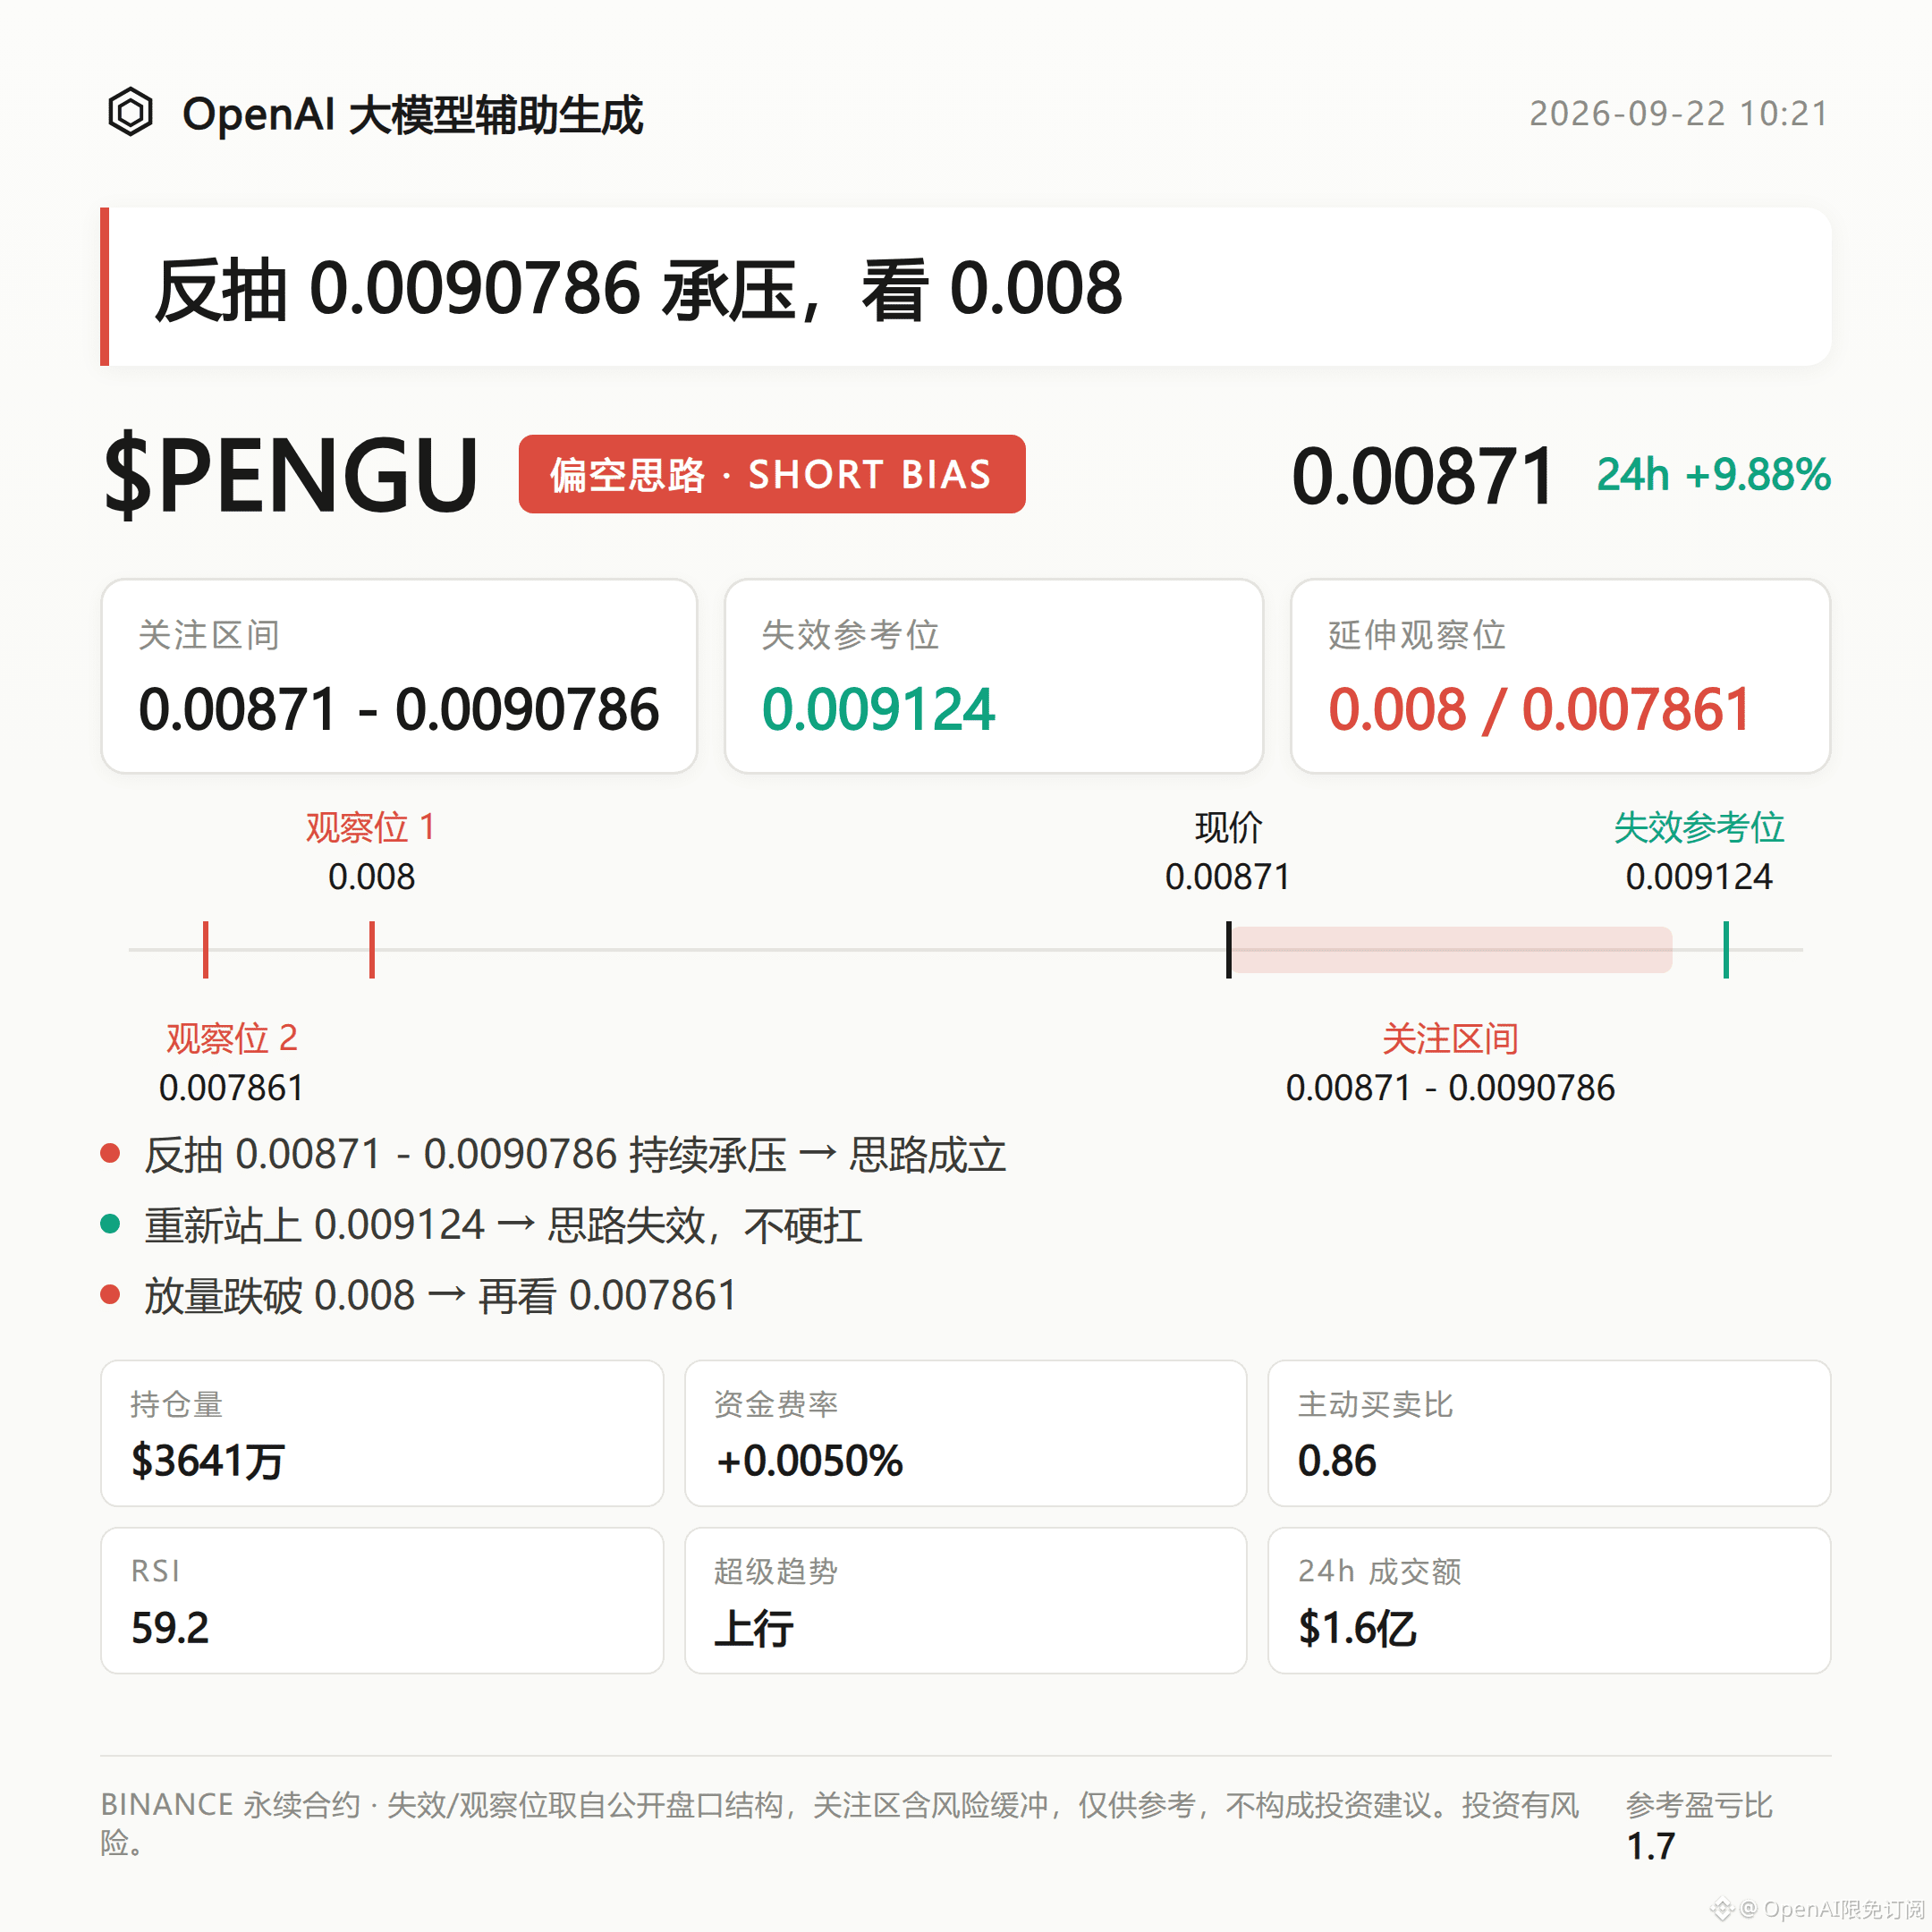
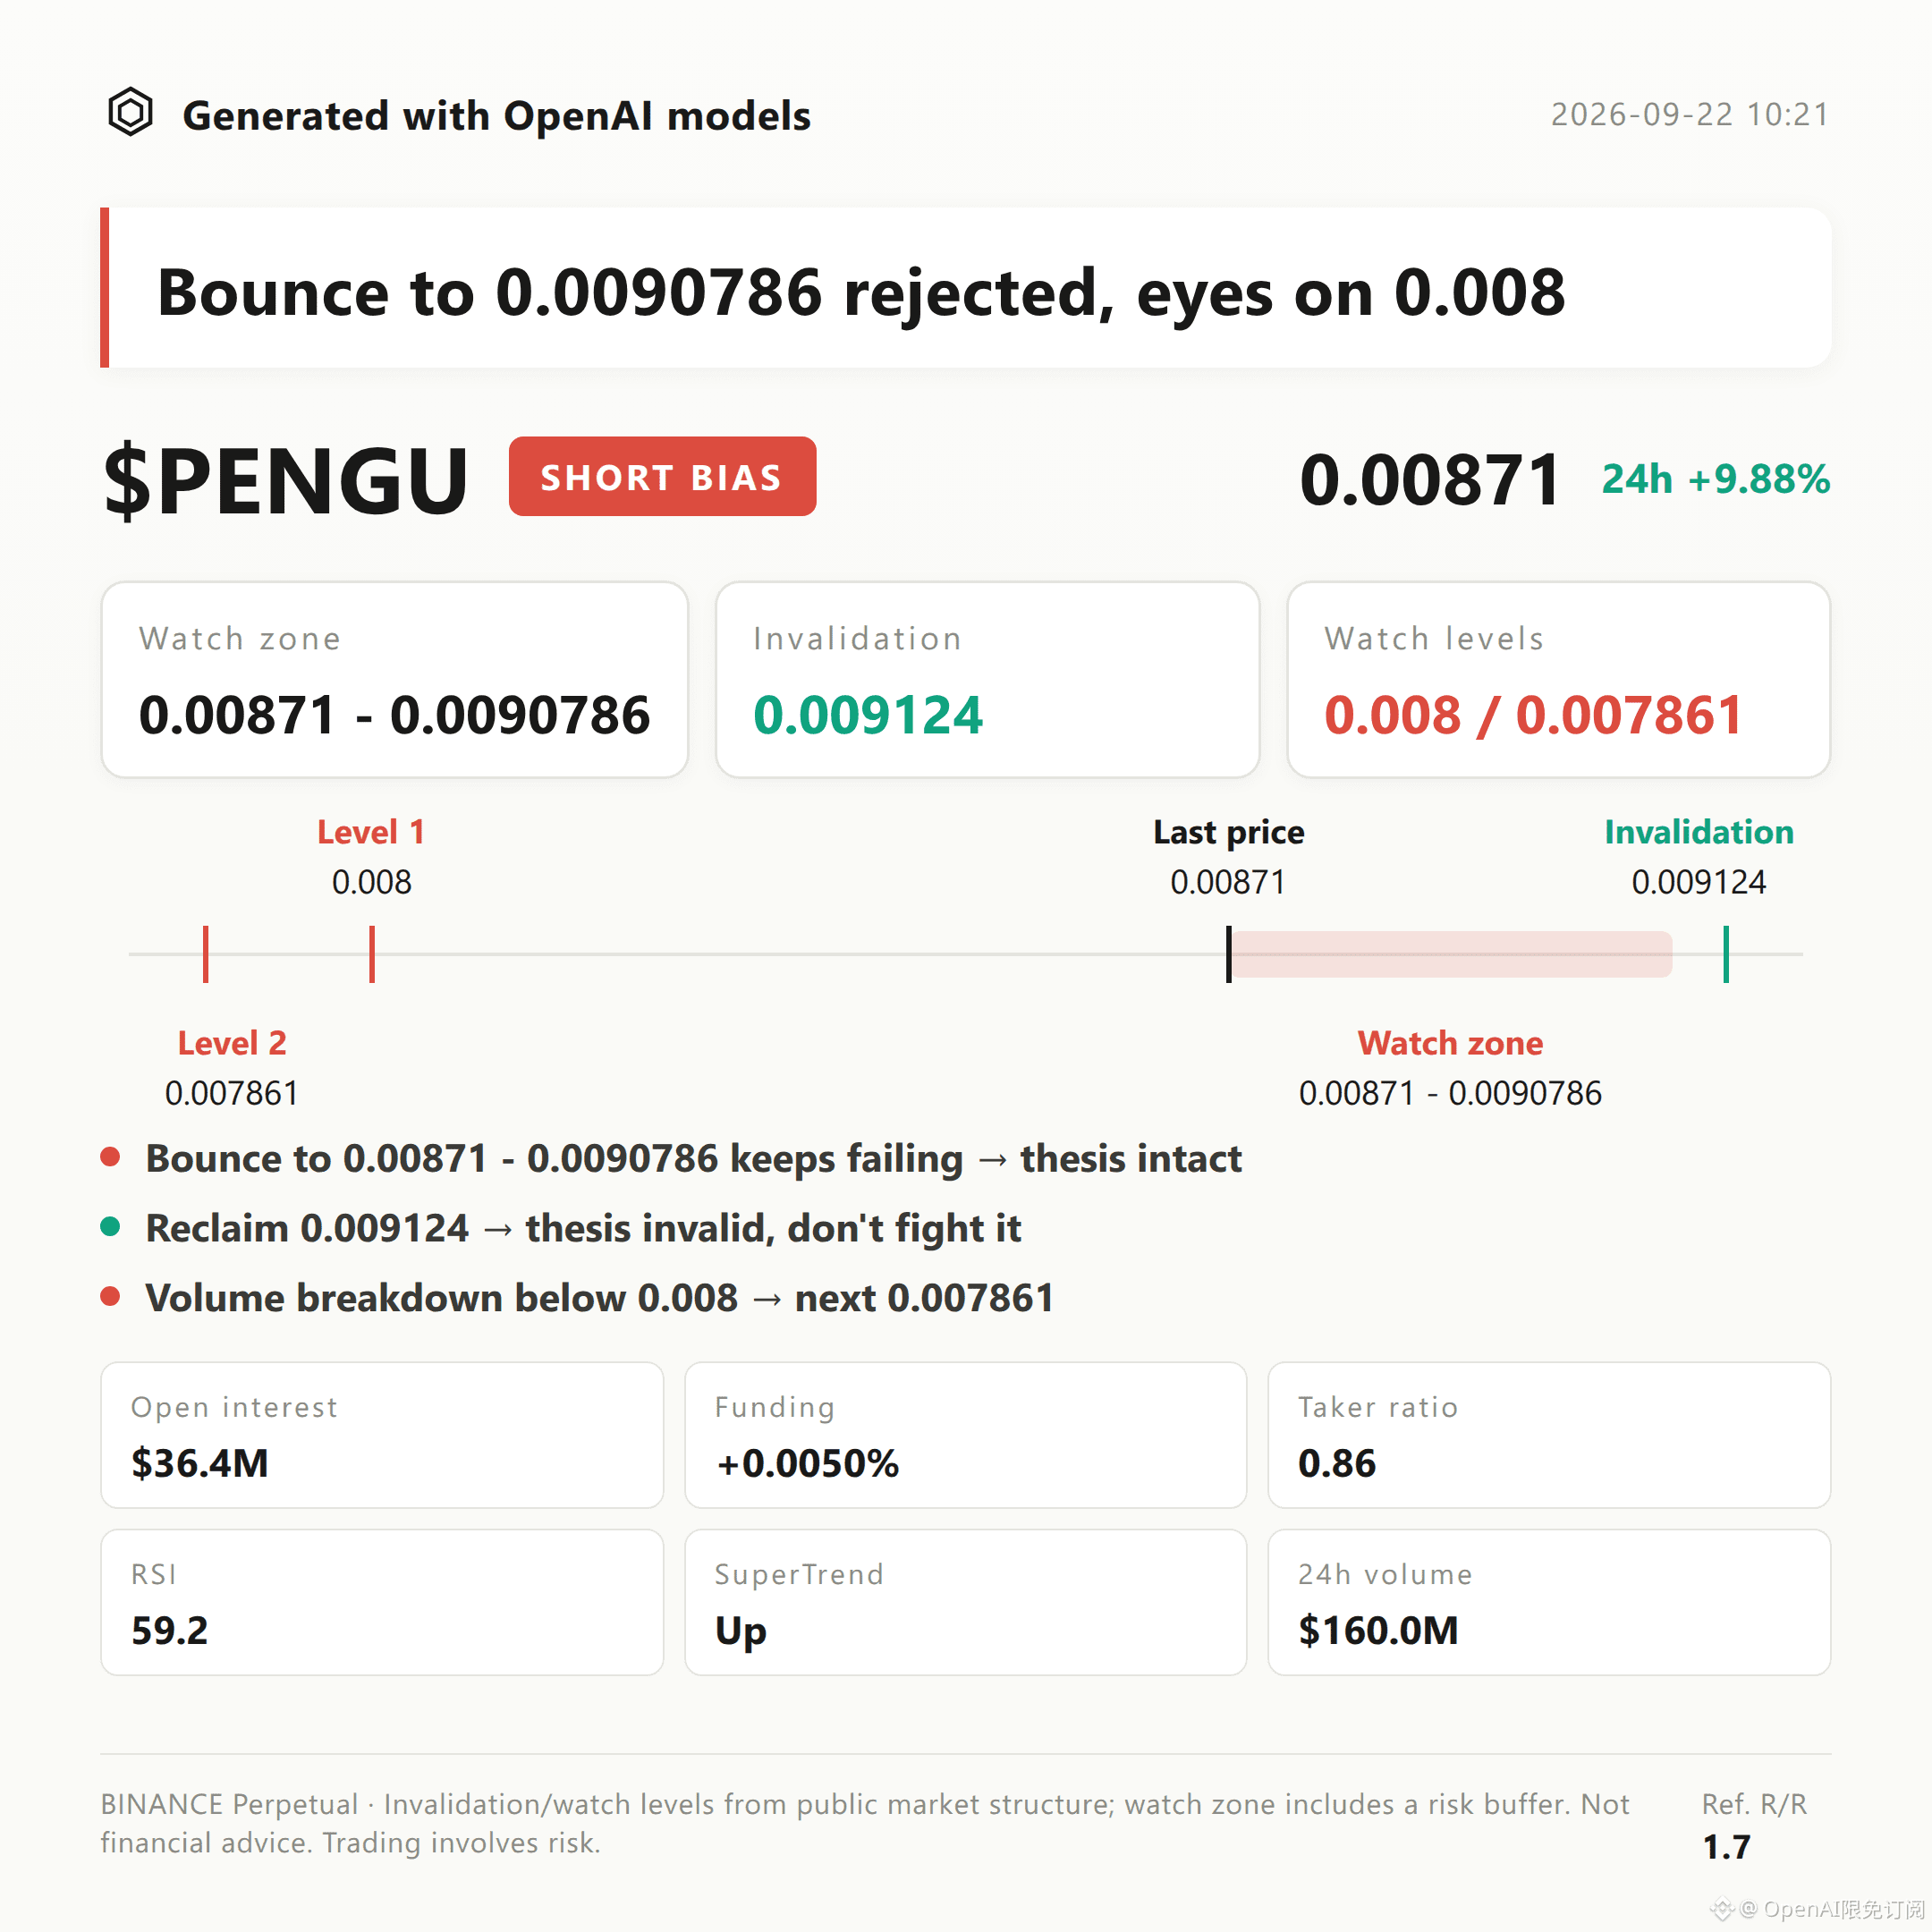
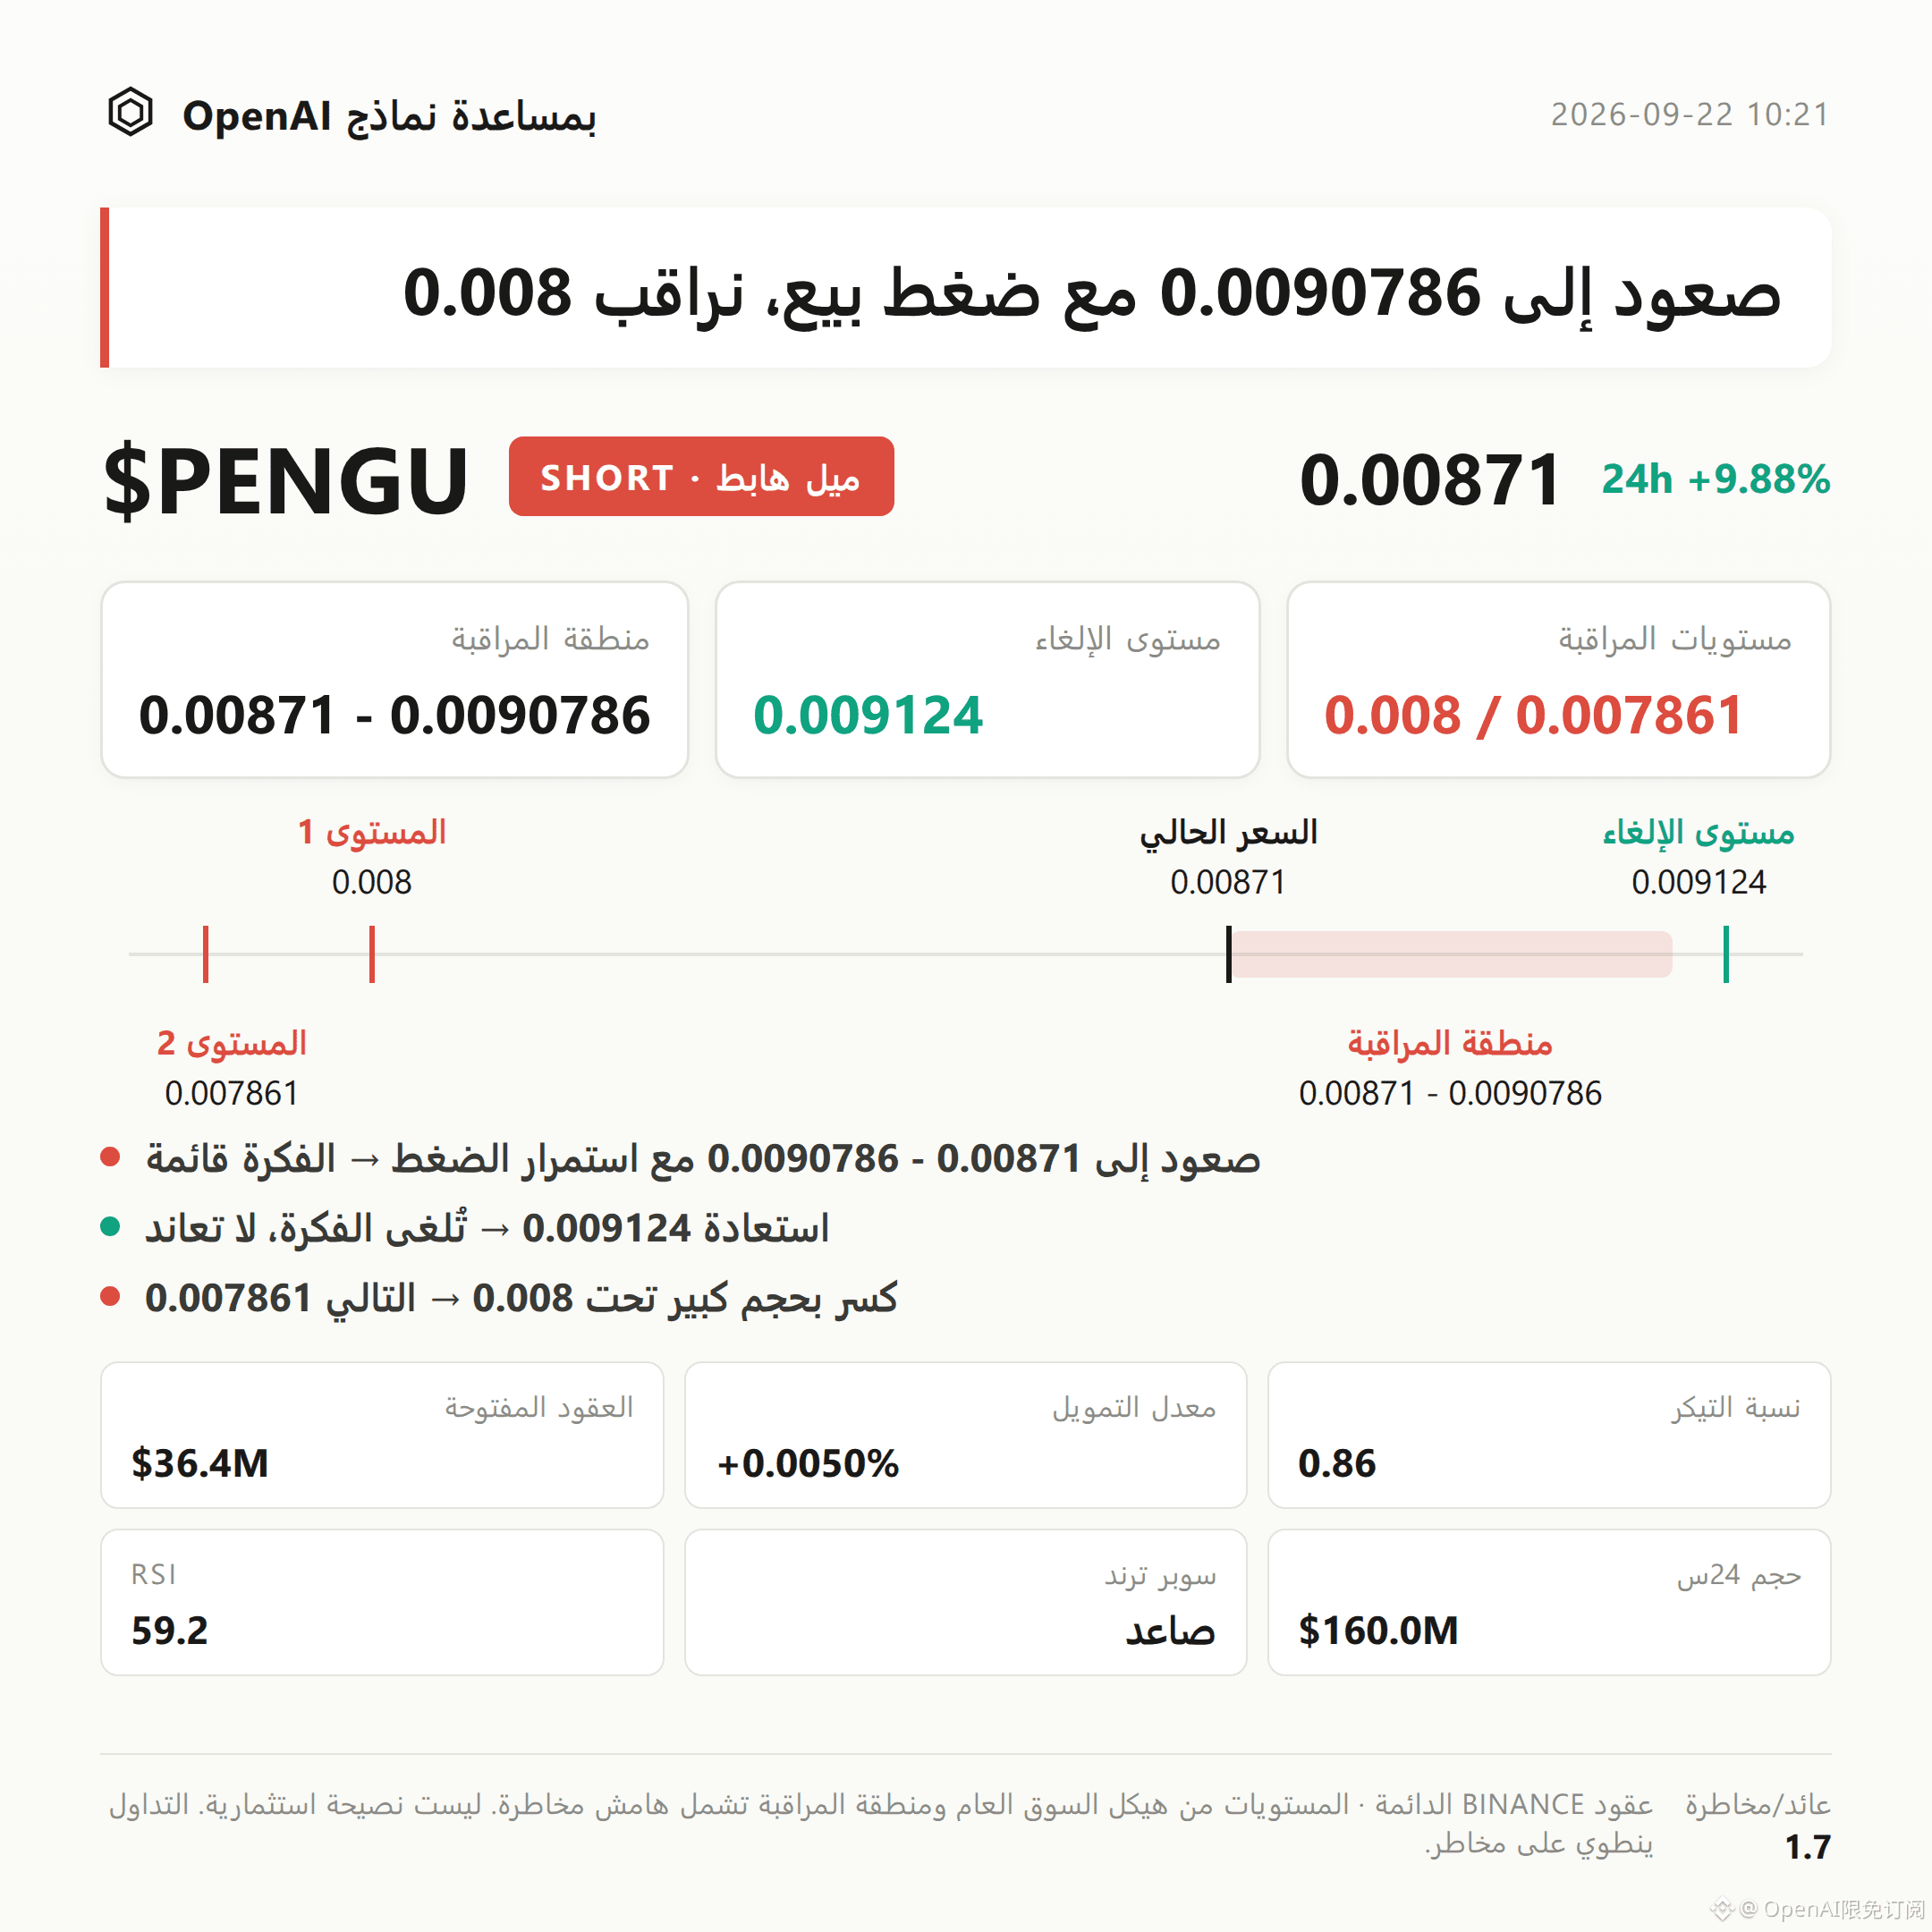
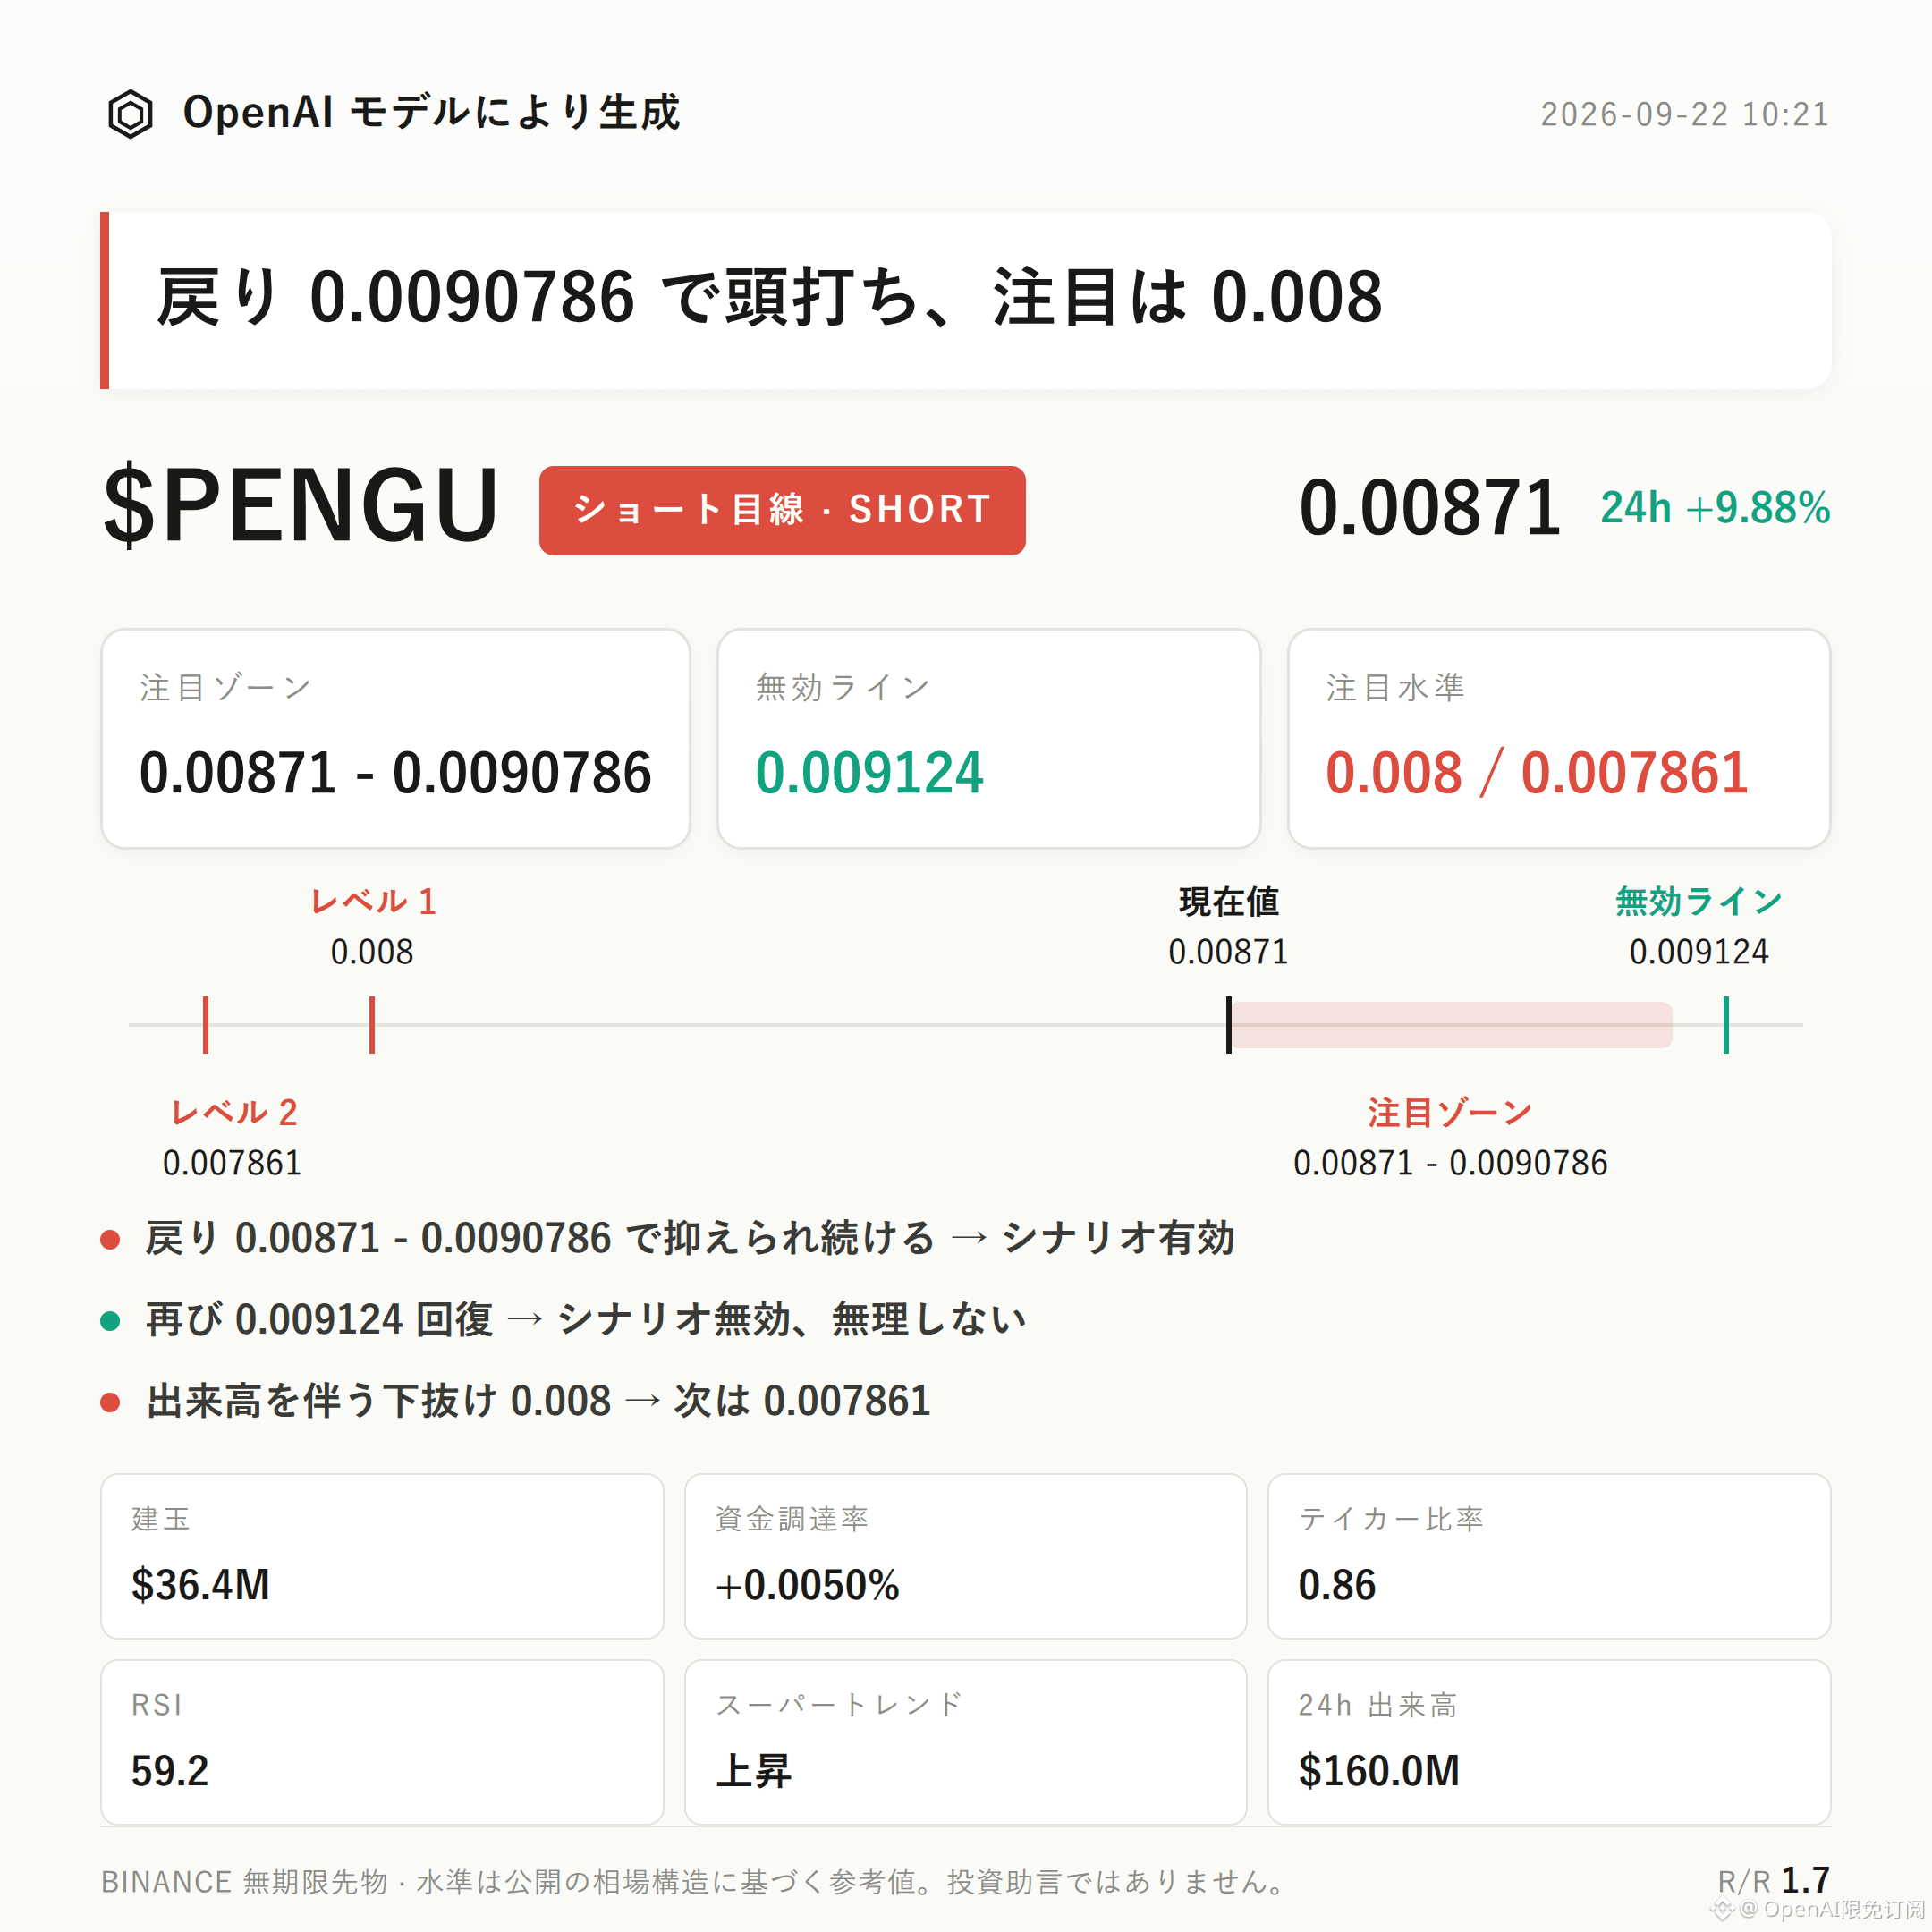
$PENGU bearish-leaning approach | Watch zone 0.00871 - 0.0090786 | Invalidation level 0.009124 | Observation levels 0.008 / 0.007861
$PENGU ’s current bearish-leaning structure is playing out.
There are three core points: the buy/sell aggressiveness ratio of 0.86 shows that sell-side aggressive orders dominate in the order book; the long vs. short account ratio indicates longs account for only 47% among the accounts, with there being slightly more short-side participants inside the market; and the current price 0.00871 has already moved close to the recent high 0.009124 and the pressure zone formed by the Bollinger upper band at 0.0091.
The key focus is whether the pullback/relief rally can be capped within the pressure zone—if it can’t, the thesis needs to be reassessed.
From the structure: $PENGU ’s recent high is 0.009124, recent low is 0.007861, and the current price is 0.00871. The 24-hour change is +9.88%, placing it in the upper part of the range.
Bollinger bands: upper band 0.0091, middle band 0.0086, lower band 0.008. Price is trading above the middle band and gradually approaching the upper band. The Super Trend indicator still shows an upward bias; RSI is 59.2; MACD maintains bullish momentum. Short-term momentum has not weakened. This needs to be stated plainly here.
Because price has already approached the pressure zone where the prior high overlaps with the Bollinger upper band, the next question—whether price continues to surge or turns weaker and pulls back here—is the critical observation point for gauging where this leg of the structure goes.
For derivatives: 24-hour trading volume is about $160 million; open interest is about $36.41 million, increasing by 10.0% over 24 hours. While price is moving up, funds continue to flow in, and the direction has not yet fully unified.
Funding rate is +0.0050%. Longs are paying a small amount to shorts; the funding pressure is not large. Combined with the fact that the short-side participants are slightly more numerous and the buy/sell aggressiveness ratio of 0.86 indicates aggressive sell dominance—this is the main derivatives clue behind the bearish view in this post.
For reference levels: on the bearish side, watch the zone from 0.00871 to 0.0090786 first. It’s more suitable to wait for confirmation after a pullback meets resistance, rather than judging bearishness directly at the current price.
If, after entering the watch zone, a pullback shows resistance and momentum weakens, then the bearish thesis is conditionally valid in the short term. If price reclaims above 0.009124, it means the current pullback structure is broken and the bearish thesis is invalid; in that case, it’s not advisable to continue using the bearish judgment.
For downside extension, watch 0.008. If it breaks down below 0.008 with increased volume, then look at support around 0.007861.
Need to be stated truthfully: in the data reviewed for this check, there are currently no significant reverse signals. Momentum indicators such as RSI, MACD, and Super Trend are still leaning bullish at the moment. The only clear risk is that the contract leverage itself amplifies uncertainty from volatility.
With contract leverage, position discipline matters more than direction judgment. Please make an independent decision based on your own risk tolerance.
For reference only and does not constitute investment advice. There is leverage in the contract; investing involves risk.
This article was generated with assistance from an OpenAI large model.
$PENGU #Contract analysis
$PENGU bearish-leaning approach | Watch zone 0.00871 - 0.0090786 | Invalidation level 0.009124 | Observation levels 0.008 / 0.007861
$PENGU ’s current bearish-leaning structure is playing out.
There are three core points: the buy/sell aggressiveness ratio of 0.86 shows that sell-side aggressive orders dominate in the order book; the long vs. short account ratio indicates longs account for only 47% among the accounts, with there being slightly more short-side participants inside the market; and the current price 0.00871 has already moved close to the recent high 0.009124 and the pressure zone formed by the Bollinger upper band at 0.0091.
The key focus is whether the pullback/relief rally can be capped within the pressure zone—if it can’t, the thesis needs to be reassessed.
From the structure: $PENGU ’s recent high is 0.009124, recent low is 0.007861, and the current price is 0.00871. The 24-hour change is +9.88%, placing it in the upper part of the range.
Bollinger bands: upper band 0.0091, middle band 0.0086, lower band 0.008. Price is trading above the middle band and gradually approaching the upper band. The Super Trend indicator still shows an upward bias; RSI is 59.2; MACD maintains bullish momentum. Short-term momentum has not weakened. This needs to be stated plainly here.
Because price has already approached the pressure zone where the prior high overlaps with the Bollinger upper band, the next question—whether price continues to surge or turns weaker and pulls back here—is the critical observation point for gauging where this leg of the structure goes.
For derivatives: 24-hour trading volume is about $160 million; open interest is about $36.41 million, increasing by 10.0% over 24 hours. While price is moving up, funds continue to flow in, and the direction has not yet fully unified.
Funding rate is +0.0050%. Longs are paying a small amount to shorts; the funding pressure is not large. Combined with the fact that the short-side participants are slightly more numerous and the buy/sell aggressiveness ratio of 0.86 indicates aggressive sell dominance—this is the main derivatives clue behind the bearish view in this post.
For reference levels: on the bearish side, watch the zone from 0.00871 to 0.0090786 first. It’s more suitable to wait for confirmation after a pullback meets resistance, rather than judging bearishness directly at the current price.
If, after entering the watch zone, a pullback shows resistance and momentum weakens, then the bearish thesis is conditionally valid in the short term. If price reclaims above 0.009124, it means the current pullback structure is broken and the bearish thesis is invalid; in that case, it’s not advisable to continue using the bearish judgment.
For downside extension, watch 0.008. If it breaks down below 0.008 with increased volume, then look at support around 0.007861.
Need to be stated truthfully: in the data reviewed for this check, there are currently no significant reverse signals. Momentum indicators such as RSI, MACD, and Super Trend are still leaning bullish at the moment. The only clear risk is that the contract leverage itself amplifies uncertainty from volatility.
With contract leverage, position discipline matters more than direction judgment. Please make an independent decision based on your own risk tolerance.
For reference only and does not constitute investment advice. There is leverage in the contract; investing involves risk.
This article was generated with assistance from an OpenAI large model.
$PENGU #Contract analysis