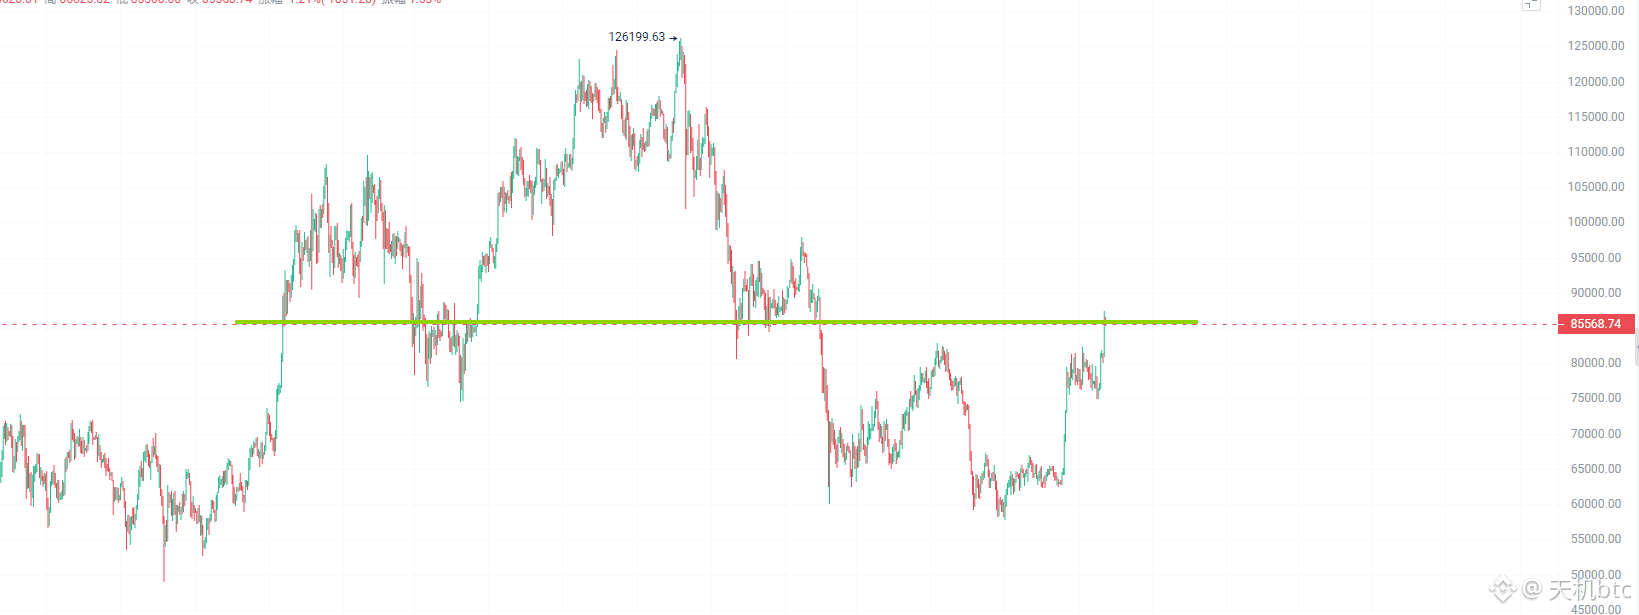
#BTC This past stretch has been pretty wild. In the 2025 rally, it surged really high—peaking around the 126,000 mark. A lot of people at the time thought it was about to take off. But ever since last October, it reversed and started getting smashed downward. In one go, it dropped a lot from the highs; the low was around 60,000. Along the way there were several rounds of choppy whipsaw. This year in the first half, the overall trend was weak. In June and July it tested a low again, where it basically stopped around the 58,000–60,000 range. In the last few months, it’s slowly been climbing. The rebound from August to now has been especially noticeable—jumping from over 70,000 to around 85,000. The red horizontal line on the chart is roughly at 85,600, and it’s quite key. Back in 2025, that level acted as support. When the price dropped, it fell below and tested there several times, with rebounds holding near this area. Later, during the big selloff, it broke below. Now that the price has risen again, it’s just tagging that line. Recently, this bullish candle has pushed up to the red line, suggesting the market is probing that level.
In short, here’s the situation:
It’s rebounded strongly from the low. In the short term it looks like there’s some momentum, but it’s currently getting pinned right at this previously important line. Pushing higher is likely to be difficult. If it can hold above this line, it may continue moving upward. If it can’t break through and gets pushed back down, there could be another pullback.
Overall, it’s still in the recovery/repair phase after the big drop—don’t be too hasty chasing highs. It’s crucial to watch whether this red line can be broken and held.
In short, here’s the situation:
It’s rebounded strongly from the low. In the short term it looks like there’s some momentum, but it’s currently getting pinned right at this previously important line. Pushing higher is likely to be difficult. If it can hold above this line, it may continue moving upward. If it can’t break through and gets pushed back down, there could be another pullback.
Overall, it’s still in the recovery/repair phase after the big drop—don’t be too hasty chasing highs. It’s crucial to watch whether this red line can be broken and held.