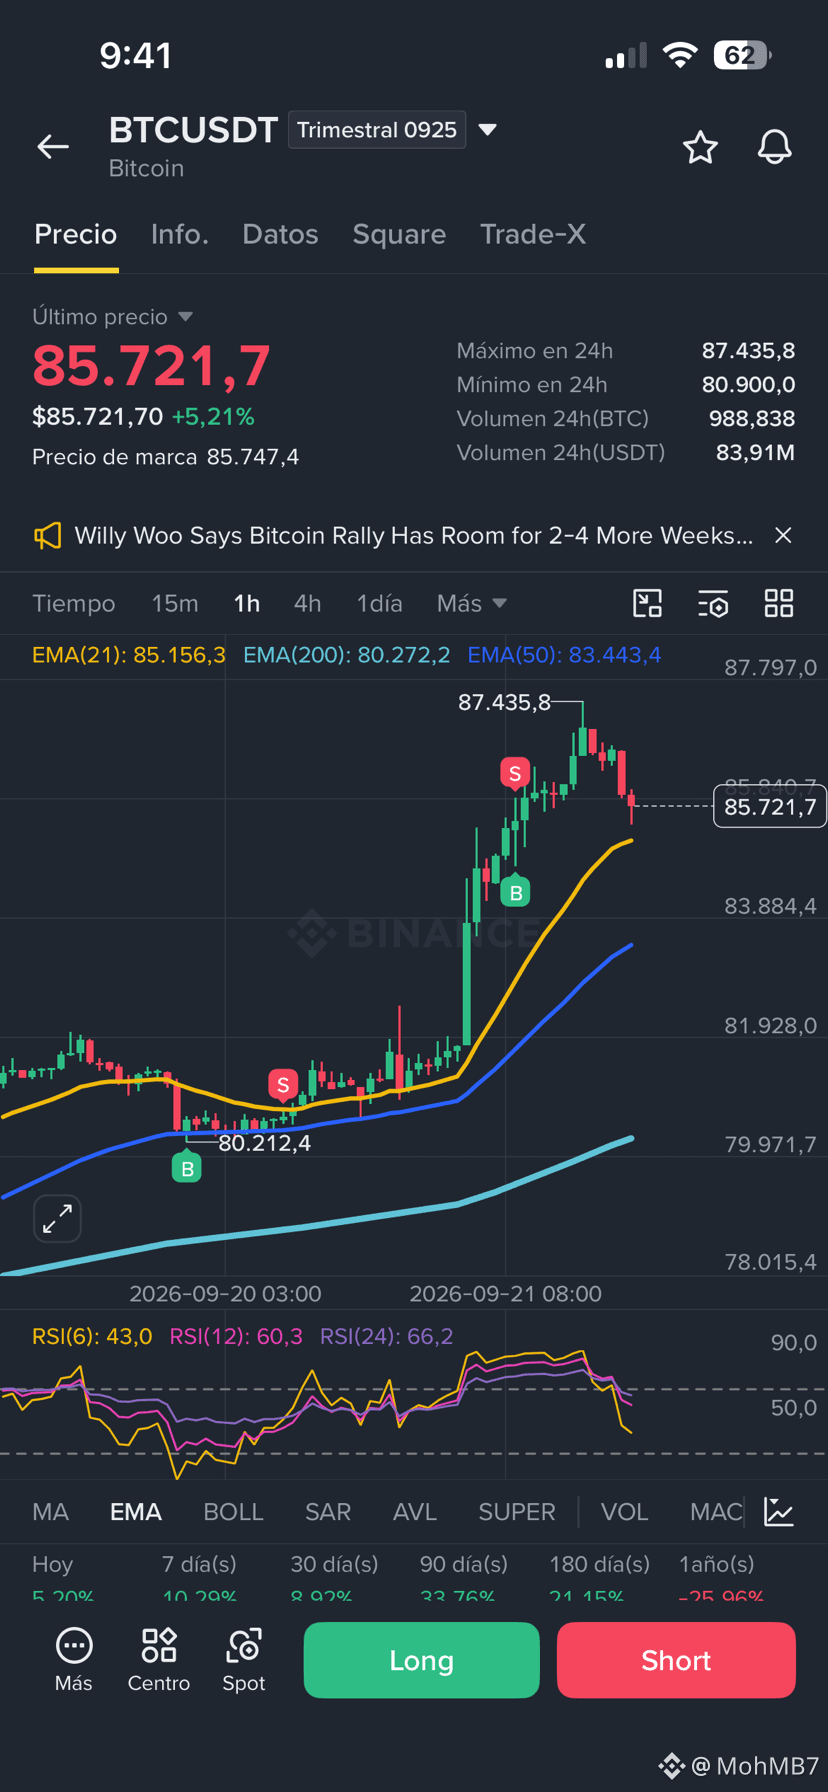
🚨 BTC/USDT: the bulls still have control, but they must defend the 21 EMA 🐂📈
Bitcoin is trading near 85,721 USDT after hitting an intraday high of 87,435 USDT. The structure on the 1H timeframe remains bullish: price is holding above the 21 EMA, the 50 EMA, and the 200 EMA. ✅
📊 Key moving averages:
🟡 EMA 21: 85,156 USDT
🔵 EMA 50: 83,443 USDT
🔷 EMA 200: 80,272 USDT
The pullback from the recent high reflects profit-taking 📉, but for now it does not invalidate the uptrend. The short-term RSI fell to 43, while the higher-period RSIs stay above 60: momentum is cooling, not necessarily a trend change. ⚖️
🎯 Levels to watch
🟢 Supports
• 85,100–85,150 USDT: 21 EMA zone
• 83,400–83,500 USDT: 50 EMA and former breakout level
• 80,900–81,000 USDT: structural support
• 80,272 USDT: 200 EMA
🔴 Resistances
• 86,000–86,500 USDT
• 87,435 USDT: recent high
• 88,000–90,000 USDT: next psychological zone 🚀
🔮 Bullish scenario: if BTC defends 85,100 USDT and reclaims 86,000 USDT, a break above 87,435 could trigger a move toward 88,000–90,000 USDT. 🐂🔥
⚠️ Bearish scenario: losing 85,100 and then 83,400 USDT would increase the risk of a correction toward 81,000–80,300 USDT. Losing 80,000 would weaken the short-term structure. 🐻
🧠 Conclusion: bias remains bullish as long as BTC respects the 83,400–85,100 USDT range. Don’t chase green candles; wait for a breakout confirmation or a controlled pullback to support. 🎯
⚠️ This content is for educational purposes and does not constitute financial advice. Manage your risk before trading. $BTC #bitcoin #crypto #trading #BinanceSquare #TechnicalAnalysis
Bitcoin is trading near 85,721 USDT after hitting an intraday high of 87,435 USDT. The structure on the 1H timeframe remains bullish: price is holding above the 21 EMA, the 50 EMA, and the 200 EMA. ✅
📊 Key moving averages:
🟡 EMA 21: 85,156 USDT
🔵 EMA 50: 83,443 USDT
🔷 EMA 200: 80,272 USDT
The pullback from the recent high reflects profit-taking 📉, but for now it does not invalidate the uptrend. The short-term RSI fell to 43, while the higher-period RSIs stay above 60: momentum is cooling, not necessarily a trend change. ⚖️
🎯 Levels to watch
🟢 Supports
• 85,100–85,150 USDT: 21 EMA zone
• 83,400–83,500 USDT: 50 EMA and former breakout level
• 80,900–81,000 USDT: structural support
• 80,272 USDT: 200 EMA
🔴 Resistances
• 86,000–86,500 USDT
• 87,435 USDT: recent high
• 88,000–90,000 USDT: next psychological zone 🚀
🔮 Bullish scenario: if BTC defends 85,100 USDT and reclaims 86,000 USDT, a break above 87,435 could trigger a move toward 88,000–90,000 USDT. 🐂🔥
⚠️ Bearish scenario: losing 85,100 and then 83,400 USDT would increase the risk of a correction toward 81,000–80,300 USDT. Losing 80,000 would weaken the short-term structure. 🐻
🧠 Conclusion: bias remains bullish as long as BTC respects the 83,400–85,100 USDT range. Don’t chase green candles; wait for a breakout confirmation or a controlled pullback to support. 🎯
⚠️ This content is for educational purposes and does not constitute financial advice. Manage your risk before trading. $BTC #bitcoin #crypto #trading #BinanceSquare #TechnicalAnalysis