$WIF
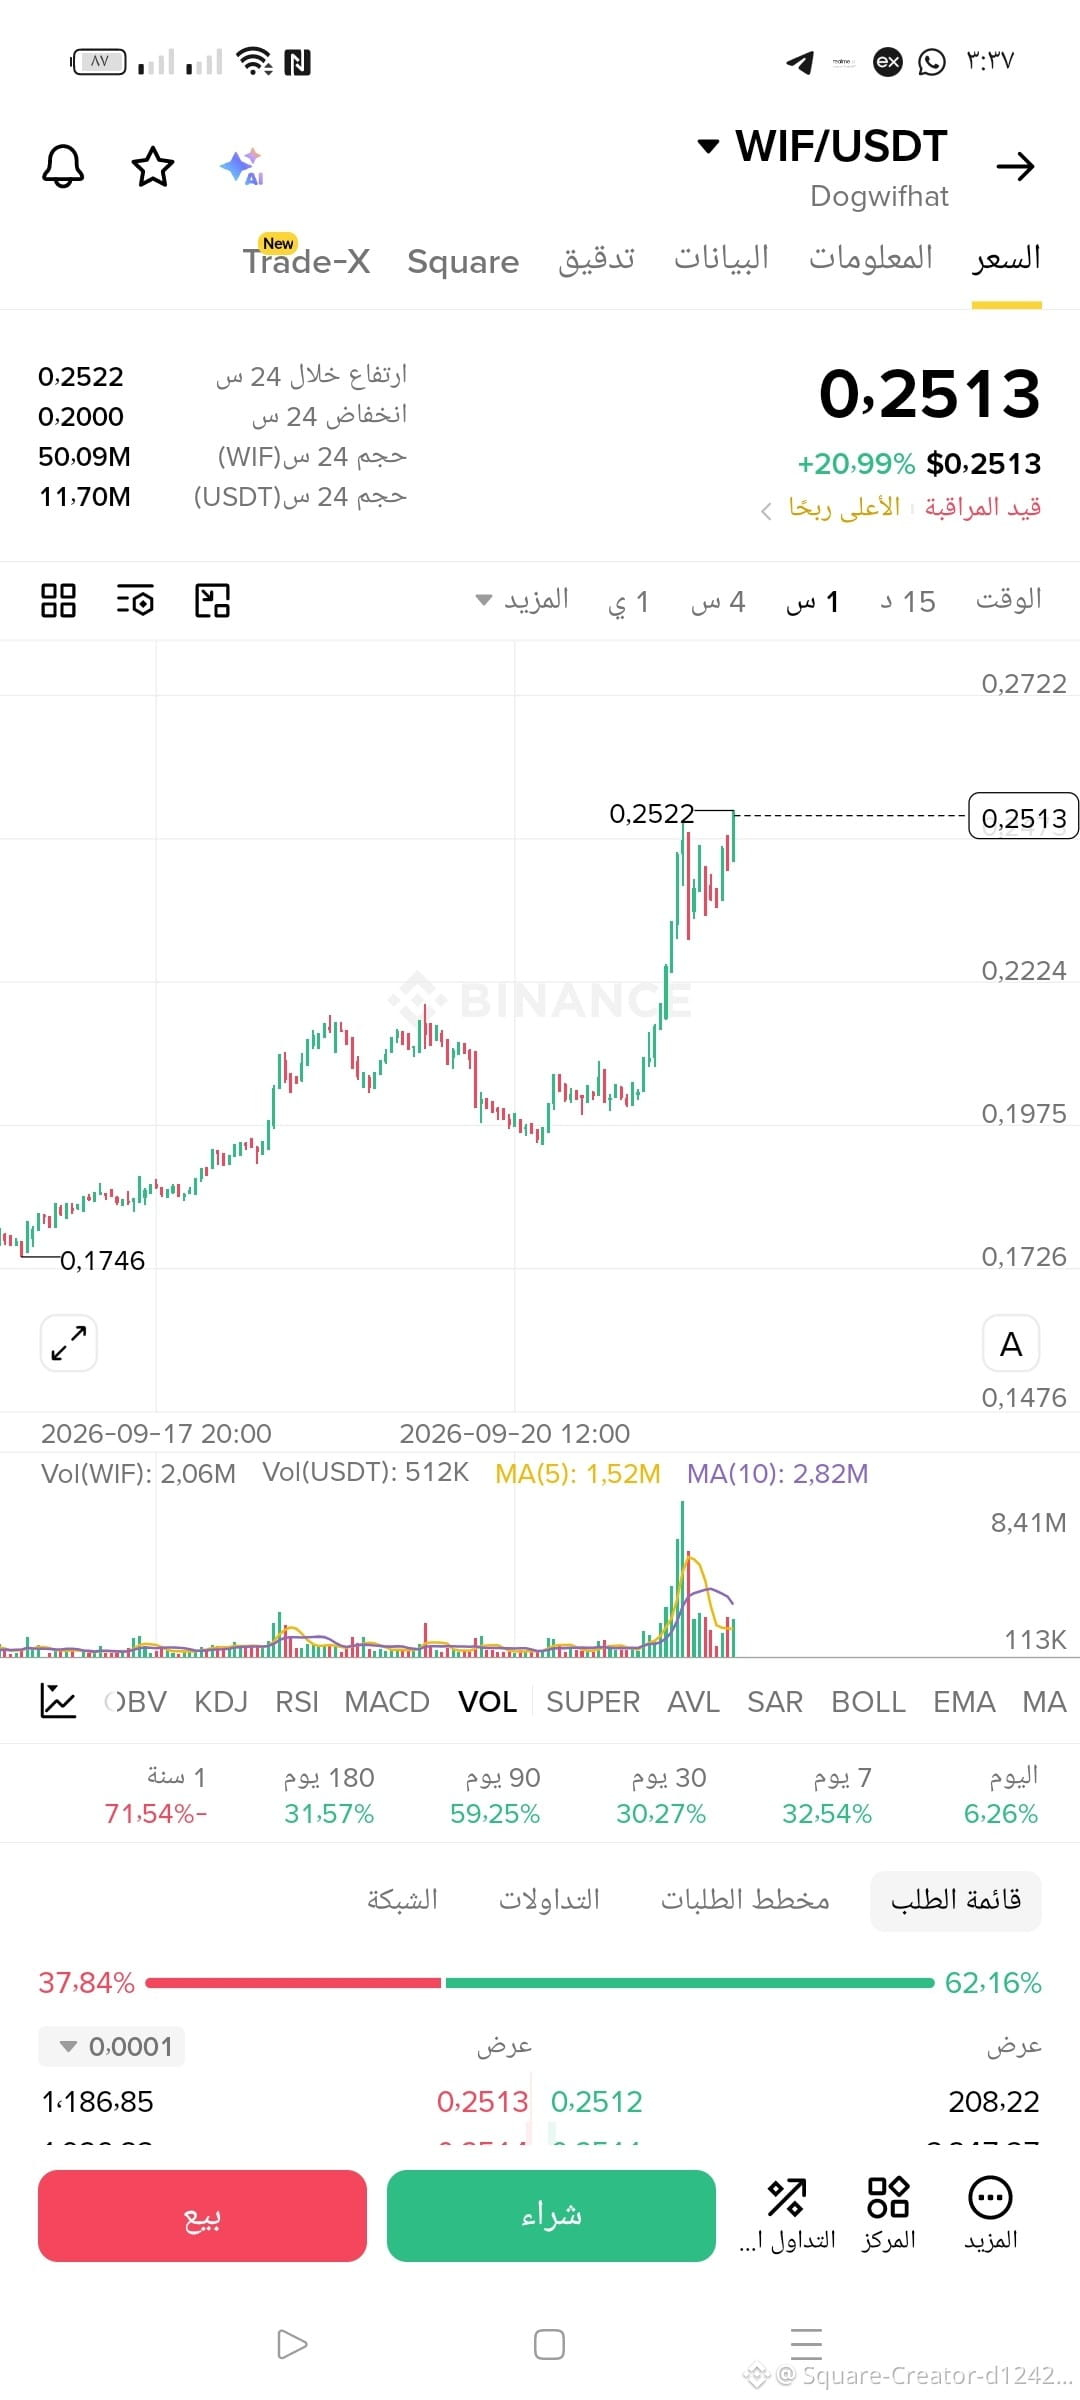
Quick Read: The price started from the bottom at 0.1746, forming a series of gradually rising peaks, then released an explosion candle with massive liquidity around September 20 toward 0.2522. The chart levels outline the map: break above 0.1975 → 0.2224, with the first upper resistance at 0.2722. The daily low is 0.2000 and the daily high is 0.2522, with a trading volume of 50.09M WIF (≈ 11.70M USDT).
🟢 Buy Zones
• 0.2340 – 0.2440 → retest of the breakout area (first entry)
• 0.2120 – 0.2220 → main demand zone above the 0.2000 low (second entry)
🎯 Take-Profit Zones
• 0.2700 – 0.2750 → resistance pivot at 0.2722
• 0.2950 – 0.3000 → extension of the move and the psychological level 0.30
• 0.3280 – 0.3350 → highest extended target
🛑 Stop Loss: 0.1960 — a 4-hour close below the 0.2000 low completely invalidates the scenario and paves the way for 0.1746.
⚖️ Risk Management: Split your entry 50% / 50% between the two zones, take profits in three portions (40% / 30% / 30%), and move your stop to the entry point after the first target. Leverage 2x–3x maximum.
⚠️ Note: WIF is up +59% over 90 days but down -71.54% over one year—this is an upside wave within a long-term downtrend. Price is at the top right now, so don’t enter before a retest of support..
$WIF #dogwifhat #Crypto #Binance #WIFUSDT #Trading #DigitalCurrencies
Quick Read: The price started from the bottom at 0.1746, forming a series of gradually rising peaks, then released an explosion candle with massive liquidity around September 20 toward 0.2522. The chart levels outline the map: break above 0.1975 → 0.2224, with the first upper resistance at 0.2722. The daily low is 0.2000 and the daily high is 0.2522, with a trading volume of 50.09M WIF (≈ 11.70M USDT).
🟢 Buy Zones
• 0.2340 – 0.2440 → retest of the breakout area (first entry)
• 0.2120 – 0.2220 → main demand zone above the 0.2000 low (second entry)
🎯 Take-Profit Zones
• 0.2700 – 0.2750 → resistance pivot at 0.2722
• 0.2950 – 0.3000 → extension of the move and the psychological level 0.30
• 0.3280 – 0.3350 → highest extended target
🛑 Stop Loss: 0.1960 — a 4-hour close below the 0.2000 low completely invalidates the scenario and paves the way for 0.1746.
⚖️ Risk Management: Split your entry 50% / 50% between the two zones, take profits in three portions (40% / 30% / 30%), and move your stop to the entry point after the first target. Leverage 2x–3x maximum.
⚠️ Note: WIF is up +59% over 90 days but down -71.54% over one year—this is an upside wave within a long-term downtrend. Price is at the top right now, so don’t enter before a retest of support..
$WIF #dogwifhat #Crypto #Binance #WIFUSDT #Trading #DigitalCurrencies