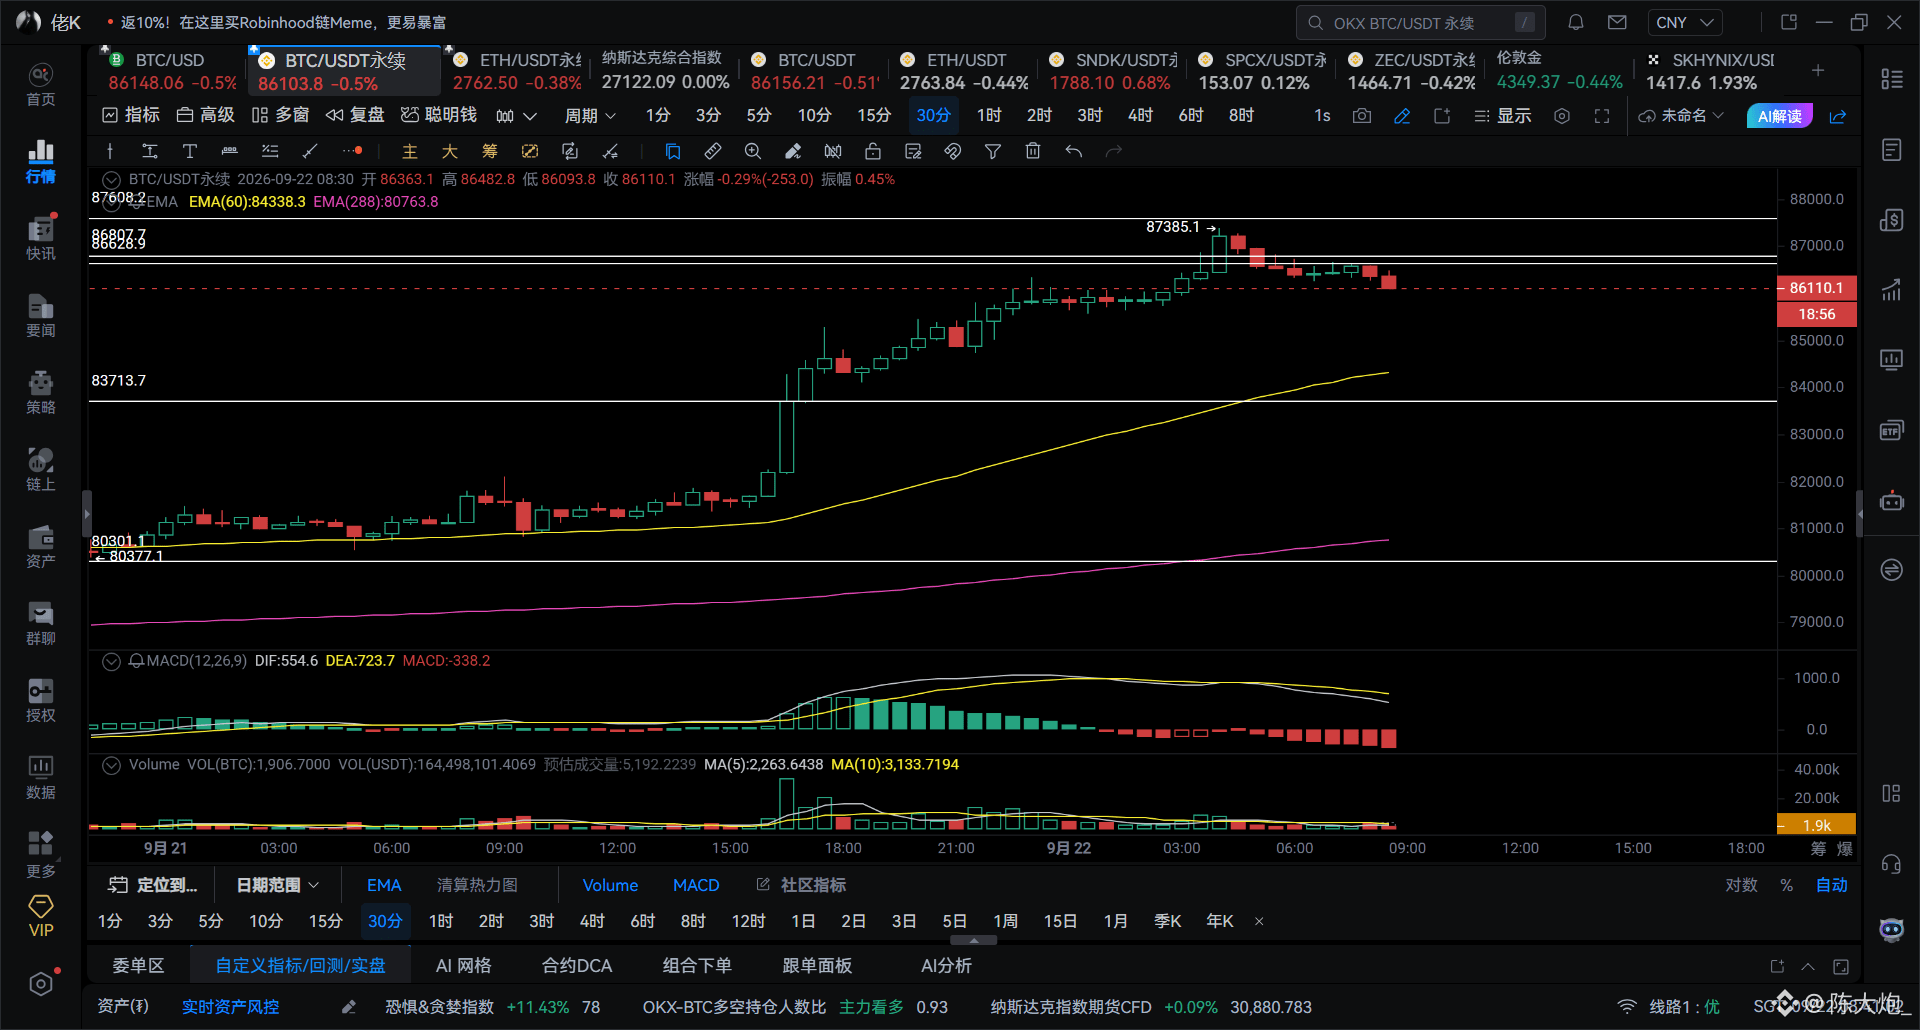

9.22 BTC market analysis
The weekly chart of BTC opened high; on the day it surged up by 6000 points. The 5-day/3-day lines show increased volume forming a strong bullish candle.
At the daily level, the golden cross returns from the zero axis and rebounds. The 12/8-hour lines are forming a pillar/stand.
The hourly chart shows a dead cross. The 45-minute/30-minute/15-minute charts form a high-altitude structure.
Intraday support below: 85564, 84344, 83713.
Intraday resistance above: 86454, 87238, 87608.
At present, the market is volatile—this is a strong bullish (uptrend) environment. However, it is also in an overbought state. Do not chase the price. $BTC
The weekly chart of BTC opened high; on the day it surged up by 6000 points. The 5-day/3-day lines show increased volume forming a strong bullish candle.
At the daily level, the golden cross returns from the zero axis and rebounds. The 12/8-hour lines are forming a pillar/stand.
The hourly chart shows a dead cross. The 45-minute/30-minute/15-minute charts form a high-altitude structure.
Intraday support below: 85564, 84344, 83713.
Intraday resistance above: 86454, 87238, 87608.
At present, the market is volatile—this is a strong bullish (uptrend) environment. However, it is also in an overbought state. Do not chase the price. $BTC