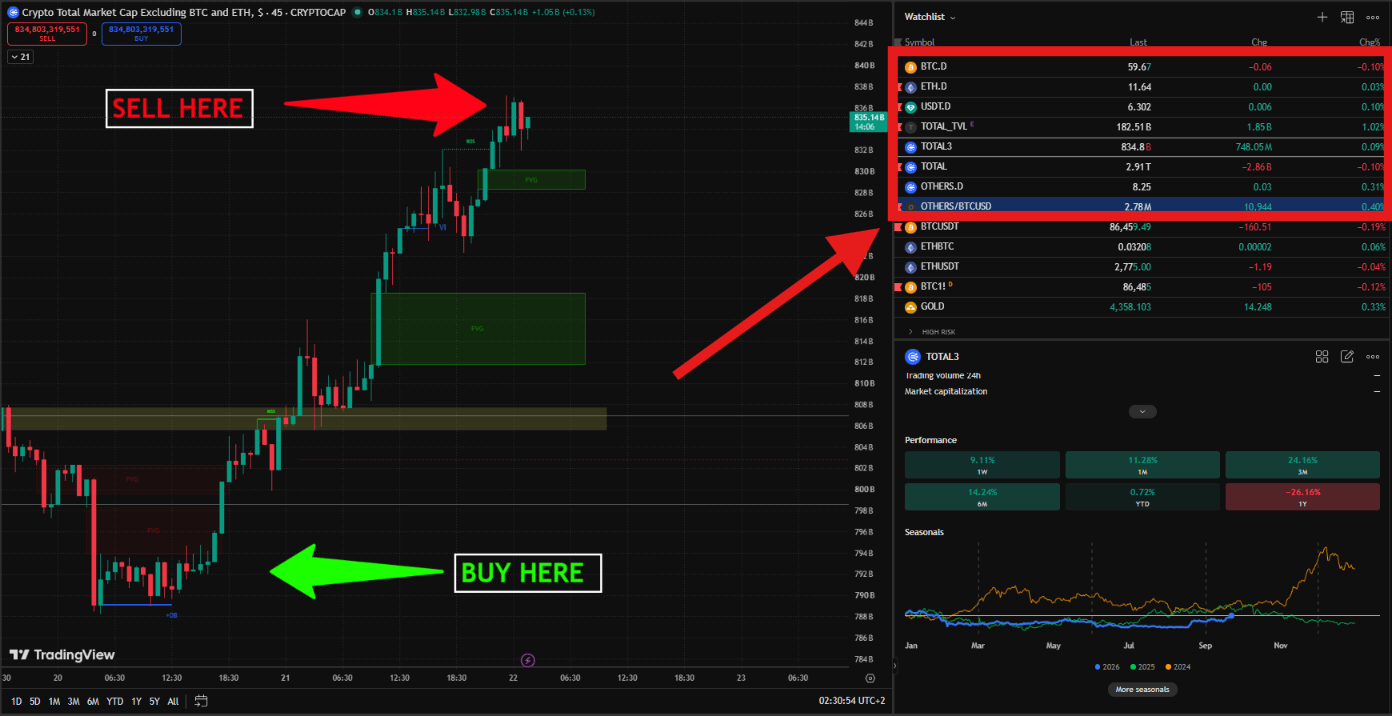

How do I know the direction of the market, and when are the best buy and sell zones?
I don’t rely on a single coin chart. Instead, I start by reading market indicators and liquidity:
1️⃣ TOTAL
It gives me the overall market direction.
📈 Uptrend = a positive environment | 📉 Downtrend = general weakness.
2️⃣ TOTAL3
To measure the strength of Altcoins away from BTC and ETH.
📈 Strength and a bounce from support = bullish | 📉 Breaking support = caution.
3️⃣ TOTAL TVL
I monitor this for liquidity and activity within the DeFi ecosystem.
📈 Rising = expansion of activity | 📉 Falling = a decline in liquidity.
4️⃣ BTC.D
Shows where market strength is concentrated.
📉 Its decline with strength in alternatives = an improving environment for Altcoins.
5️⃣ ETH.D
Helps me understand the shift of liquidity toward ETH and other sectors.
6️⃣ USDT.D
An important indicator for risk appetite.
📉 Its decline = greater inclination toward risk | 📈 Its rise = more caution.
7️⃣ OTHERS.D
I watch it to see whether smaller coins start taking a larger share of the market.
8️⃣ OTHERS/BTC
I use it to compare the performance of Altcoins versus Bitcoin.
📈 Its rise = alternatives outperform | 📉 Its fall = BTC has the advantage.
Summary:
There is no single indicator that gives me a clear BUY or SELL.
I compile this data first to determine the market direction and where the liquidity is, then I move to the chart to choose buy and sell zones and targets.
I don’t rely on a single coin chart. Instead, I start by reading market indicators and liquidity:
1️⃣ TOTAL
It gives me the overall market direction.
📈 Uptrend = a positive environment | 📉 Downtrend = general weakness.
2️⃣ TOTAL3
To measure the strength of Altcoins away from BTC and ETH.
📈 Strength and a bounce from support = bullish | 📉 Breaking support = caution.
3️⃣ TOTAL TVL
I monitor this for liquidity and activity within the DeFi ecosystem.
📈 Rising = expansion of activity | 📉 Falling = a decline in liquidity.
4️⃣ BTC.D
Shows where market strength is concentrated.
📉 Its decline with strength in alternatives = an improving environment for Altcoins.
5️⃣ ETH.D
Helps me understand the shift of liquidity toward ETH and other sectors.
6️⃣ USDT.D
An important indicator for risk appetite.
📉 Its decline = greater inclination toward risk | 📈 Its rise = more caution.
7️⃣ OTHERS.D
I watch it to see whether smaller coins start taking a larger share of the market.
8️⃣ OTHERS/BTC
I use it to compare the performance of Altcoins versus Bitcoin.
📈 Its rise = alternatives outperform | 📉 Its fall = BTC has the advantage.
Summary:
There is no single indicator that gives me a clear BUY or SELL.
I compile this data first to determine the market direction and where the liquidity is, then I move to the chart to choose buy and sell zones and targets.