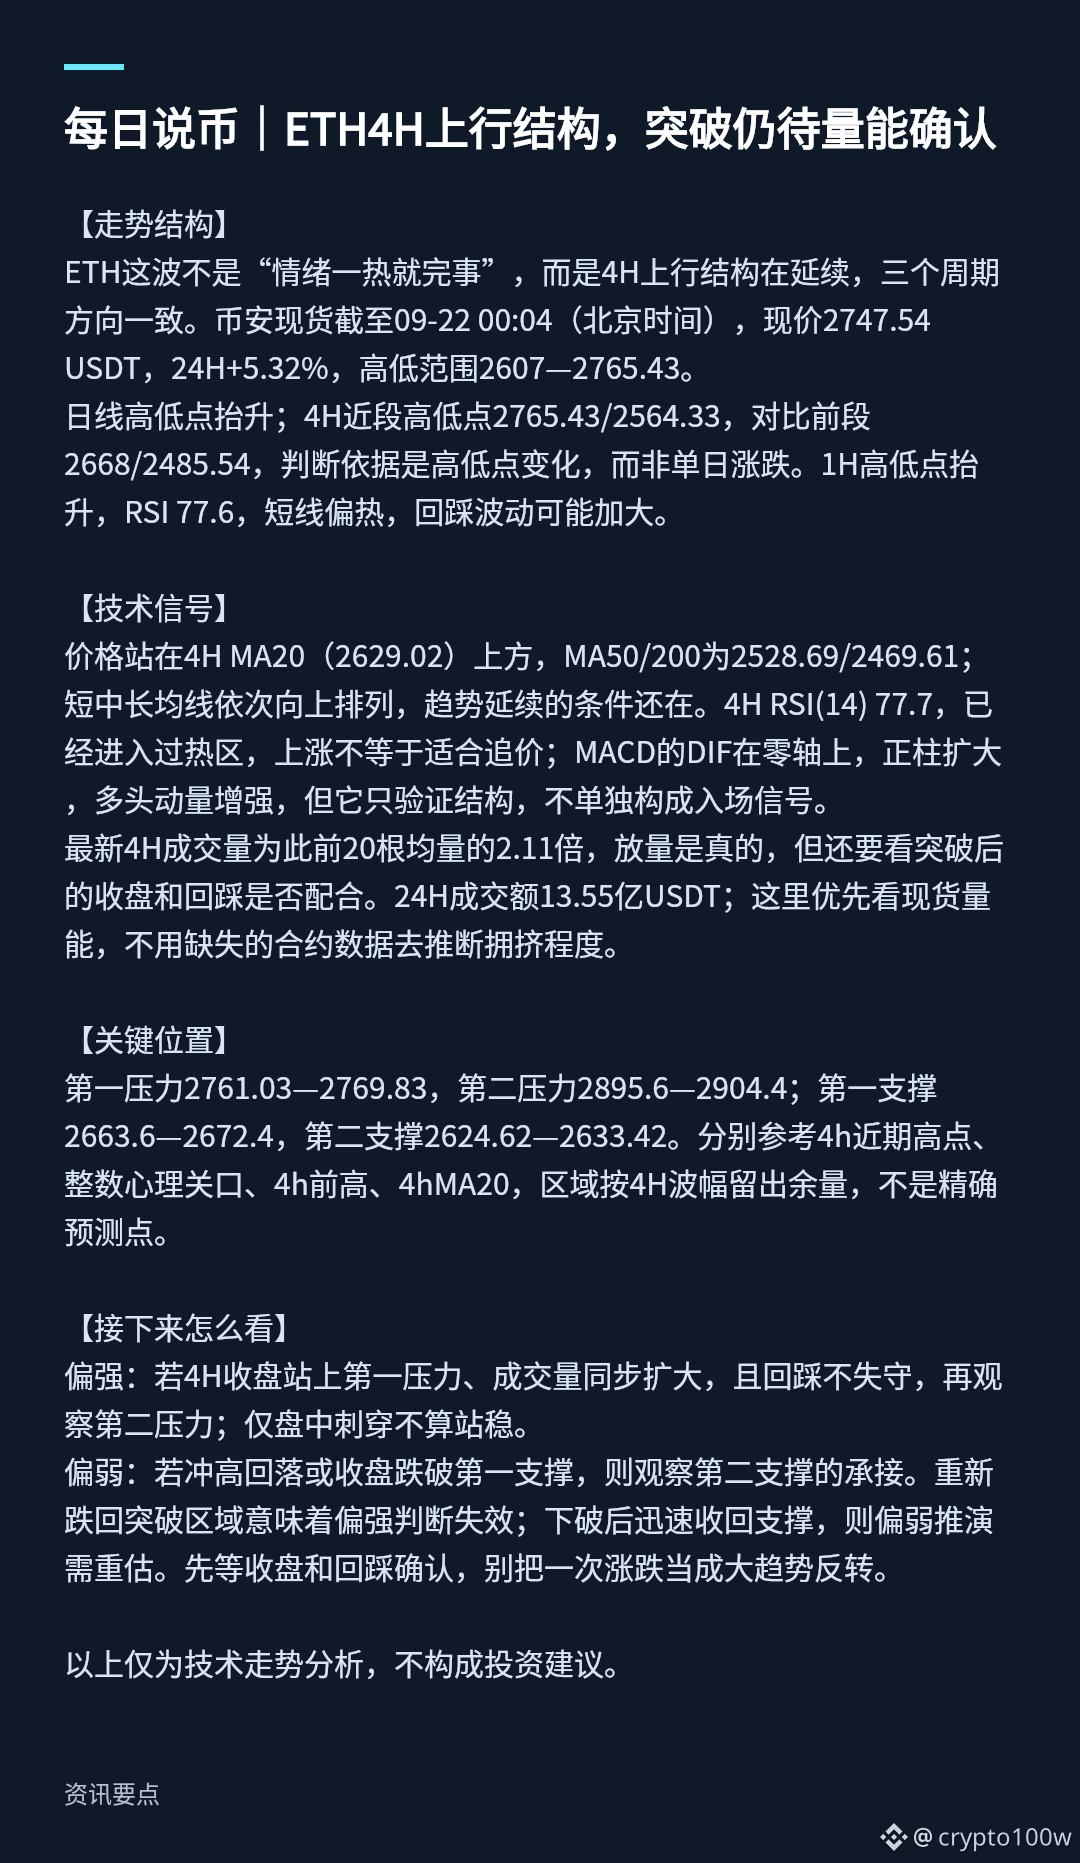
【Market Structure】
This ETH move isn’t “over as soon as the sentiment heats up.” Instead, the 4H uptrend structure is continuing, with three cycles moving in the same direction. As of 09-22 00:04 (Beijing time), Binance spot shows the current price at 2747.54 USDT, up +5.32% over the past 24H, with a high-low range of 2607—2765.43.
Daily highs and lows are rising. On 4H, the recent high/low points are 2765.43/2564.33; compared with the prior 2668/2485.54, the judgment is based on the change in high/low points rather than day-to-day gains or losses. On 1H, highs and lows are rising as well; RSI is 77.6, suggesting the short-term is overheated and pullback fluctuations may increase.
【Technical Signals】
Price is above the 4H MA20 (2629.02). MA50/200 are 2528.69/2469.61. The short-, mid-, and long-term moving averages are stacked in an upward sequence, so the conditions for trend continuation are still present. The 4H RSI(14) is 77.7, already in an overbought/overheated zone. Rising does not necessarily mean it’s suitable to chase the price. MACD’s DIF is above the zero line, with positive bars widening and bullish momentum strengthening, but it only confirms the structure and does not, by itself, serve as an entry signal.
The latest 4H trading volume is 2.11x the average volume of the previous 20 candles—volume expansion is real, but we still need to see whether the close after a breakout and any subsequent pullback work in coordination. 24H trading amount is 1.355 billion USDT. Here, we prioritize spot volume rather than inferring crowded positioning from missing futures data.
【Key Levels】
First resistance: 2761.03—2769.83. Second resistance: 2895.6—2904.4.
First support: 2663.6—2672.4. Second support: 2624.62—2633.42.
Use these as references for the recent 4H swing highs, round-number psychological levels, the prior 4H high, and the 4H MA20. The zones leave room based on the 4H swing range—these are not exact target predictions.
【What to Watch Next】
More bullish: If the 4H close is above the first resistance with volume expanding in sync, and the pullback does not break down, then watch the second resistance. Intraday spikes alone don’t count as “holding”—it needs to stabilize.
More bearish: If the rally fails and turns into a drop, or if the close breaks below the first support, then observe whether the second support can hold. Falling back into the breakout zone means the bullish thesis is invalid. After a breakdown, if price quickly reclaims support, then the bearish scenario needs to be reassessed. Wait for confirmation from the close and the pullback—don’t treat a single rise/fall as a major trend reversal.
The above is only technical trend analysis and does not constitute investment advice.
This ETH move isn’t “over as soon as the sentiment heats up.” Instead, the 4H uptrend structure is continuing, with three cycles moving in the same direction. As of 09-22 00:04 (Beijing time), Binance spot shows the current price at 2747.54 USDT, up +5.32% over the past 24H, with a high-low range of 2607—2765.43.
Daily highs and lows are rising. On 4H, the recent high/low points are 2765.43/2564.33; compared with the prior 2668/2485.54, the judgment is based on the change in high/low points rather than day-to-day gains or losses. On 1H, highs and lows are rising as well; RSI is 77.6, suggesting the short-term is overheated and pullback fluctuations may increase.
【Technical Signals】
Price is above the 4H MA20 (2629.02). MA50/200 are 2528.69/2469.61. The short-, mid-, and long-term moving averages are stacked in an upward sequence, so the conditions for trend continuation are still present. The 4H RSI(14) is 77.7, already in an overbought/overheated zone. Rising does not necessarily mean it’s suitable to chase the price. MACD’s DIF is above the zero line, with positive bars widening and bullish momentum strengthening, but it only confirms the structure and does not, by itself, serve as an entry signal.
The latest 4H trading volume is 2.11x the average volume of the previous 20 candles—volume expansion is real, but we still need to see whether the close after a breakout and any subsequent pullback work in coordination. 24H trading amount is 1.355 billion USDT. Here, we prioritize spot volume rather than inferring crowded positioning from missing futures data.
【Key Levels】
First resistance: 2761.03—2769.83. Second resistance: 2895.6—2904.4.
First support: 2663.6—2672.4. Second support: 2624.62—2633.42.
Use these as references for the recent 4H swing highs, round-number psychological levels, the prior 4H high, and the 4H MA20. The zones leave room based on the 4H swing range—these are not exact target predictions.
【What to Watch Next】
More bullish: If the 4H close is above the first resistance with volume expanding in sync, and the pullback does not break down, then watch the second resistance. Intraday spikes alone don’t count as “holding”—it needs to stabilize.
More bearish: If the rally fails and turns into a drop, or if the close breaks below the first support, then observe whether the second support can hold. Falling back into the breakout zone means the bullish thesis is invalid. After a breakdown, if price quickly reclaims support, then the bearish scenario needs to be reassessed. Wait for confirmation from the close and the pullback—don’t treat a single rise/fall as a major trend reversal.
The above is only technical trend analysis and does not constitute investment advice.