📊 ZEC$/USDT — Reading the timeframes like a pro
The mistake many traders make is that they see 1H or 4H in red and think the trend has ended.
But the timeframe must not be read separately from the larger timeframe.
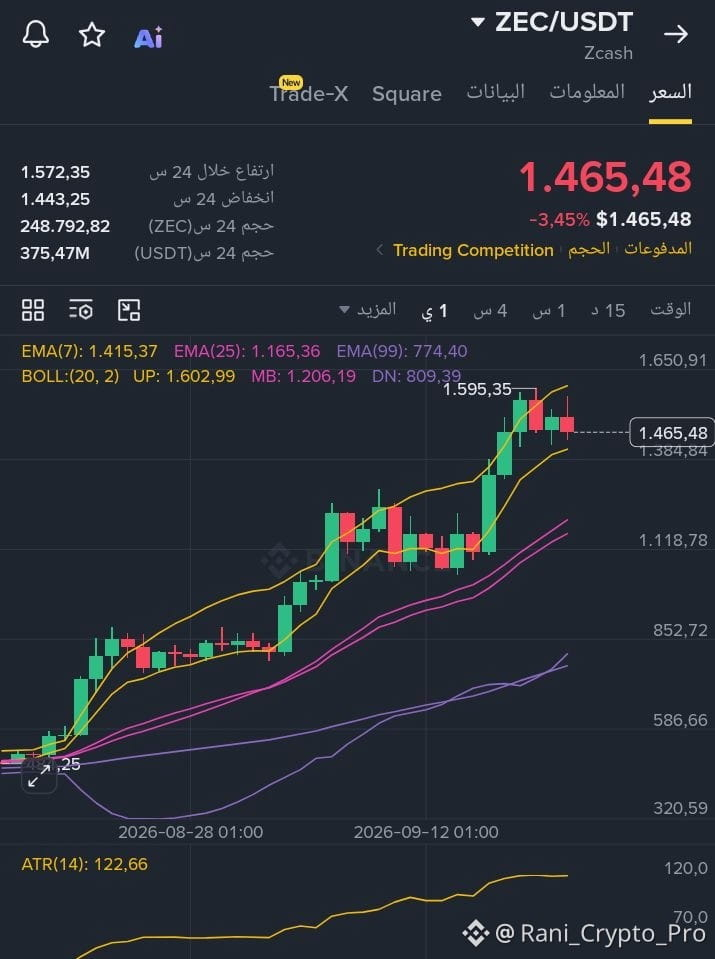
🟢 The daily chart is the foundation: as long as the daily structure is still bullish and the price holds the key support zones, the drop on smaller timeframes is technically classified as a bearish correction / a downward bounce within the uptrend—not a full reversal.
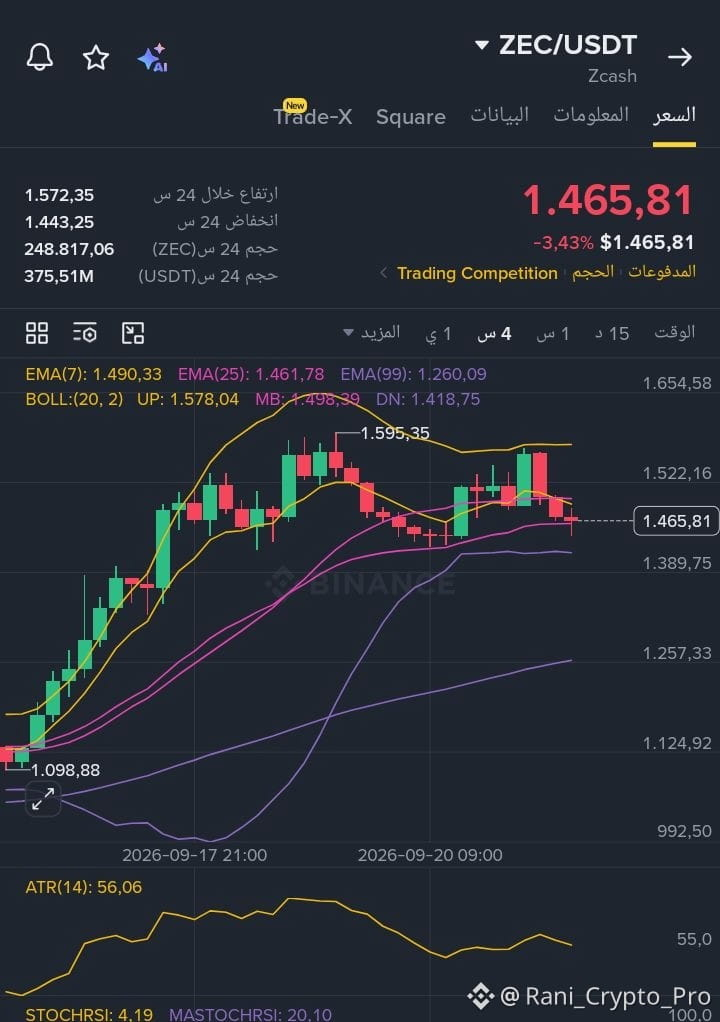
🔸 4H: It shows us the depth of the correction and the support areas where the decline may stop.
🔸 1H: We watch it to know when the correction starts losing strength.
🔸 15M: We use it to time the entry after a bounce signal appears.
🎯 The trade
LONG: 1460–1480$
SL: 1425–1430$
TP1: 1520$
TP2: 1560$
TP3: 1590–1600$
💡 The important reason:
The market doesn’t move in a straight line. Even a strong uptrend needs pullbacks to take profit and rebalance liquidity. Therefore, a drop on 15M or 1H shouldn’t worry us as long as it hasn’t broken the structure and the important supports on the higher timeframe.
🔥 In short:
The daily chart defines the direction, 4H defines the correction zone, and 1H & 15M define the timing of the return.
That’s why we don’t judge the ZEC direction based on only a bearish candle on a small timeframe.
$ZEC
The mistake many traders make is that they see 1H or 4H in red and think the trend has ended.
But the timeframe must not be read separately from the larger timeframe.
🟢 The daily chart is the foundation: as long as the daily structure is still bullish and the price holds the key support zones, the drop on smaller timeframes is technically classified as a bearish correction / a downward bounce within the uptrend—not a full reversal.
🔸 4H: It shows us the depth of the correction and the support areas where the decline may stop.
🔸 1H: We watch it to know when the correction starts losing strength.
🔸 15M: We use it to time the entry after a bounce signal appears.
🎯 The trade
LONG: 1460–1480$
SL: 1425–1430$
TP1: 1520$
TP2: 1560$
TP3: 1590–1600$
💡 The important reason:
The market doesn’t move in a straight line. Even a strong uptrend needs pullbacks to take profit and rebalance liquidity. Therefore, a drop on 15M or 1H shouldn’t worry us as long as it hasn’t broken the structure and the important supports on the higher timeframe.
🔥 In short:
The daily chart defines the direction, 4H defines the correction zone, and 1H & 15M define the timing of the return.
That’s why we don’t judge the ZEC direction based on only a bearish candle on a small timeframe.
$ZEC