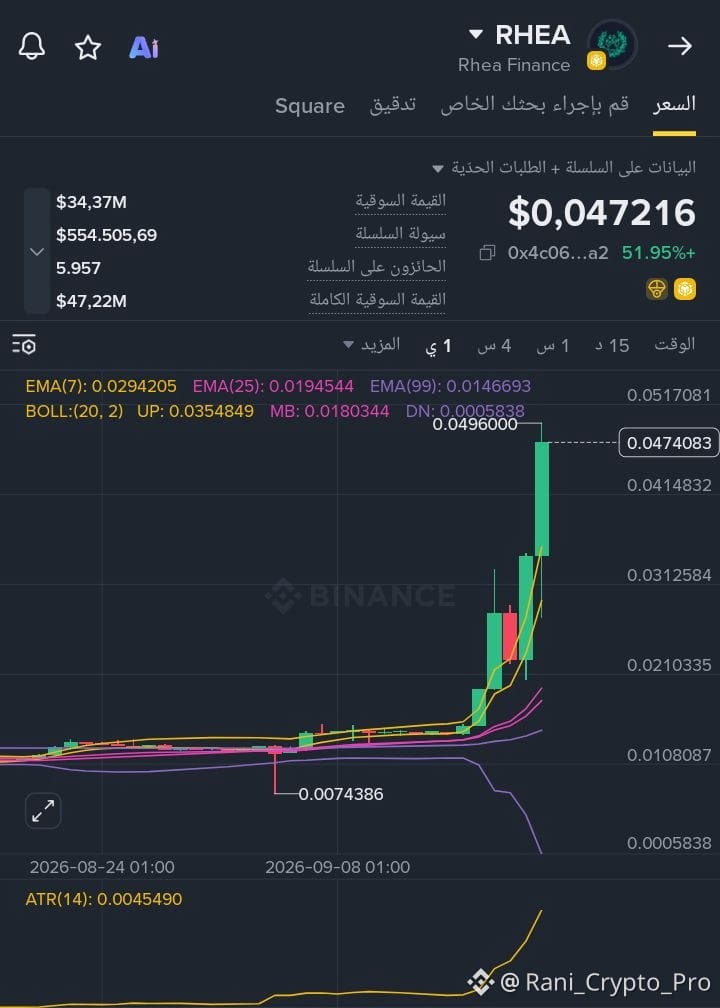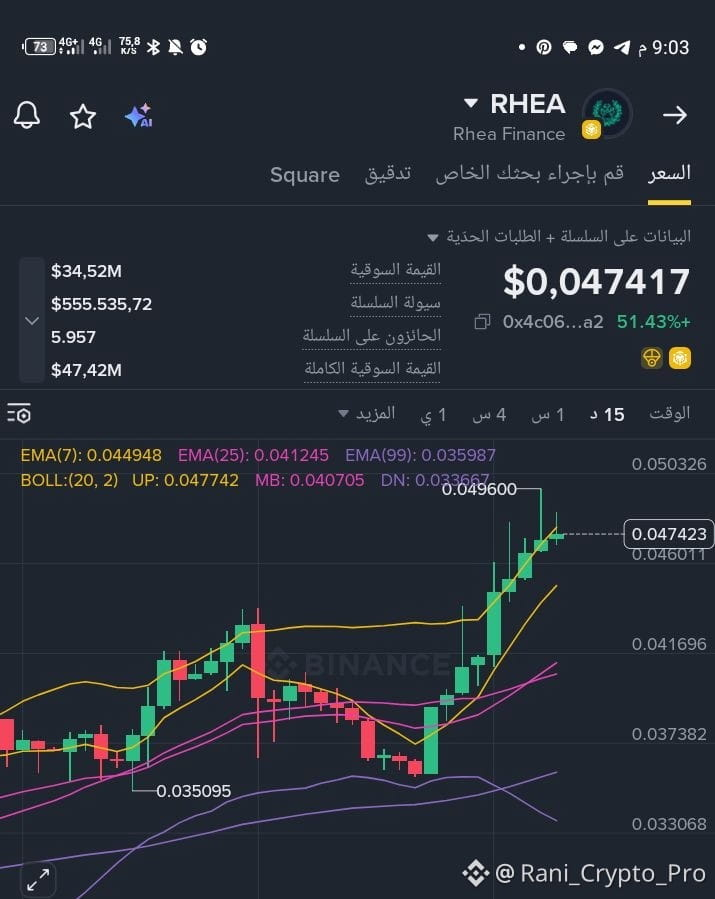
15 minutes: Bullish trend$RHEA; the price is above the EMA7/25/99, and the MACD is positive.
1 hour: Strong upward move with consecutive breakouts, and very high momentum.
4 hours: The trend clearly turned bullish, and the price is above the moving averages.
Daily timeframe: The bullish move is very strong, with rising volume and a positive MACD.
Higher timeframe: The price has exited the previous consolidation area and broke through key levels, supporting the continuation of the uptrend.
⚠️ Important point: The upward move is strong, but RSI and Stoch RSI are in very overbought territory, and the price is close to the upper Bollinger Band; therefore the likelihood of a pullback/short cooldown before continuing the move has increased.
Technical summary:
🟢 Overall trend: Bullish across all shown timeframes
🟢 Momentum: Strong
🟢 MACD: Positive
🟢 Volume: Supports the move
🔴 Overbought: Very high
🔴 Volatility: Very high
The most important current level is 0.0460–0.0470; holding above it keeps the bullish structure strong, while breaking 0.043–0.044 could open the way for a deeper correction.
1 hour: Strong upward move with consecutive breakouts, and very high momentum.
4 hours: The trend clearly turned bullish, and the price is above the moving averages.
Daily timeframe: The bullish move is very strong, with rising volume and a positive MACD.
Higher timeframe: The price has exited the previous consolidation area and broke through key levels, supporting the continuation of the uptrend.
⚠️ Important point: The upward move is strong, but RSI and Stoch RSI are in very overbought territory, and the price is close to the upper Bollinger Band; therefore the likelihood of a pullback/short cooldown before continuing the move has increased.
Technical summary:
🟢 Overall trend: Bullish across all shown timeframes
🟢 Momentum: Strong
🟢 MACD: Positive
🟢 Volume: Supports the move
🔴 Overbought: Very high
🔴 Volatility: Very high
The most important current level is 0.0460–0.0470; holding above it keeps the bullish structure strong, while breaking 0.043–0.044 could open the way for a deeper correction.