*$VVV
/USDT*$VVV
Current price *31.757$* is rising *12.62%* in 24 hours.
Today’s high is 34.666$ and low is 27.965$, with high trading volume of 4.70M VVV / 151M USDT.
*Averages:*
- MA7 at 26.518
- MA25 at 21.501
- MA99 at 15.128
The price is above all three averages and the trend is bullish. The move started from the bottom *11.069$* on August 11, and the whole chart shows large green candles with small pullbacks.
*Indicators:*
- *RSI 75.636*: above 70, meaning overbought. Buying now has high risk because the indicator needs to cool down.
- *OBV 587M*: at a new peak and rising along with the price, meaning liquidity is still flowing in strongly and supports the upward move.
*Important chart levels:*
- Near support: 31.7 then 26.5, which is MA7
- Strong support: the 25.4 zone where it bounced before the peak
- Resistance: 34.666, the last high. If it breaks, it opens new room; if it fails, it forms a double top
Current situation: very strong rally but late. Direct entry in the market is risky due to the high RSI and the distance from the averages. It’s better to wait for consolidation or a pullback that touches MA7.#ZetaChainVotesToMigrateZETAToSolana .
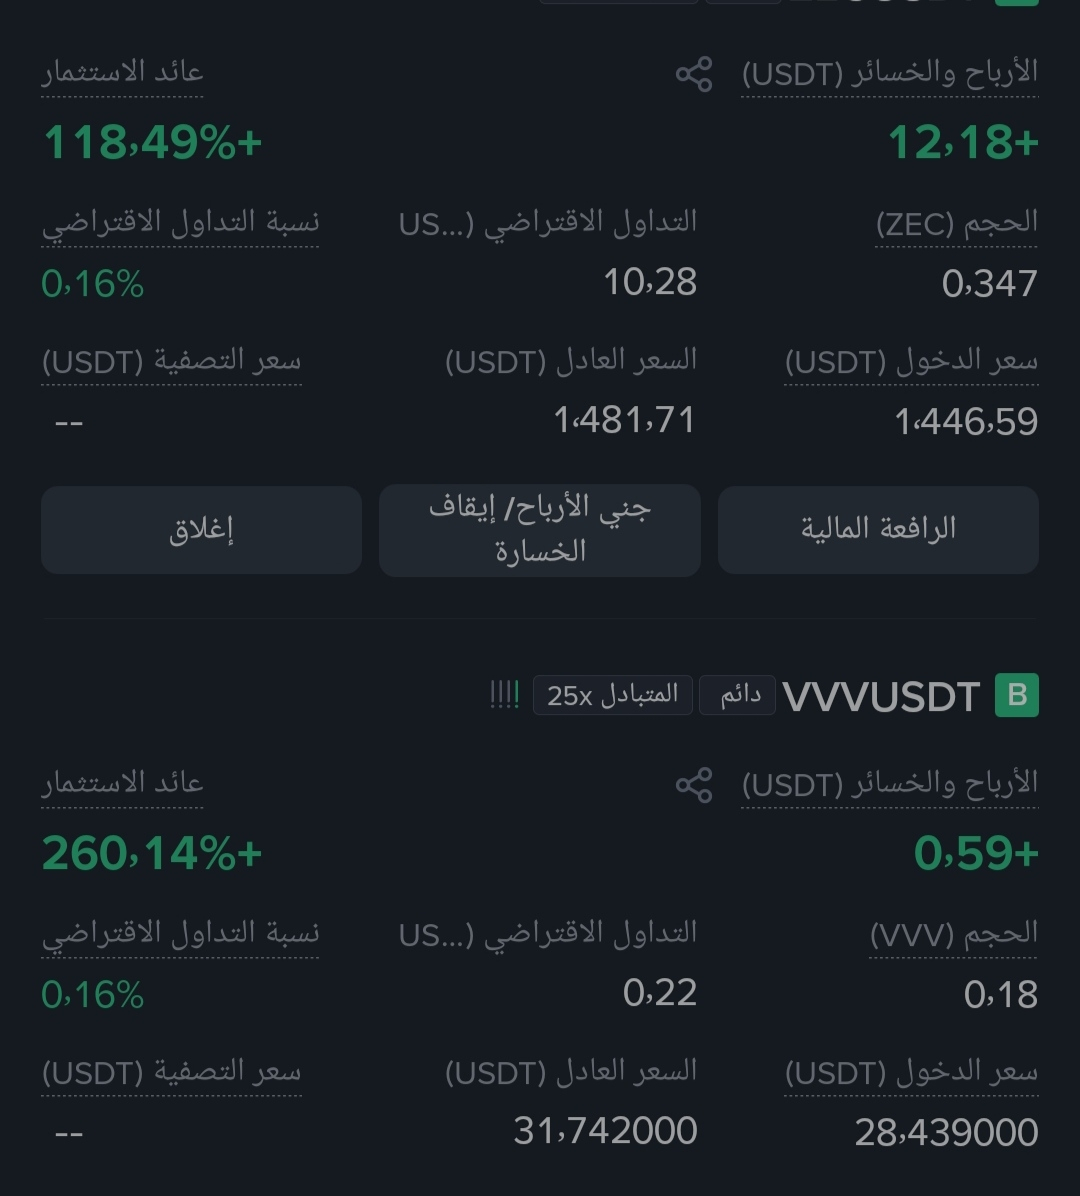
I entered at the lowest price to confirm the direction👇
/USDT*$VVV
Current price *31.757$* is rising *12.62%* in 24 hours.
Today’s high is 34.666$ and low is 27.965$, with high trading volume of 4.70M VVV / 151M USDT.
*Averages:*
- MA7 at 26.518
- MA25 at 21.501
- MA99 at 15.128
The price is above all three averages and the trend is bullish. The move started from the bottom *11.069$* on August 11, and the whole chart shows large green candles with small pullbacks.
*Indicators:*
- *RSI 75.636*: above 70, meaning overbought. Buying now has high risk because the indicator needs to cool down.
- *OBV 587M*: at a new peak and rising along with the price, meaning liquidity is still flowing in strongly and supports the upward move.
*Important chart levels:*
- Near support: 31.7 then 26.5, which is MA7
- Strong support: the 25.4 zone where it bounced before the peak
- Resistance: 34.666, the last high. If it breaks, it opens new room; if it fails, it forms a double top
Current situation: very strong rally but late. Direct entry in the market is risky due to the high RSI and the distance from the averages. It’s better to wait for consolidation or a pullback that touches MA7.#ZetaChainVotesToMigrateZETAToSolana .
I entered at the lowest price to confirm the direction👇