【Market Structure】
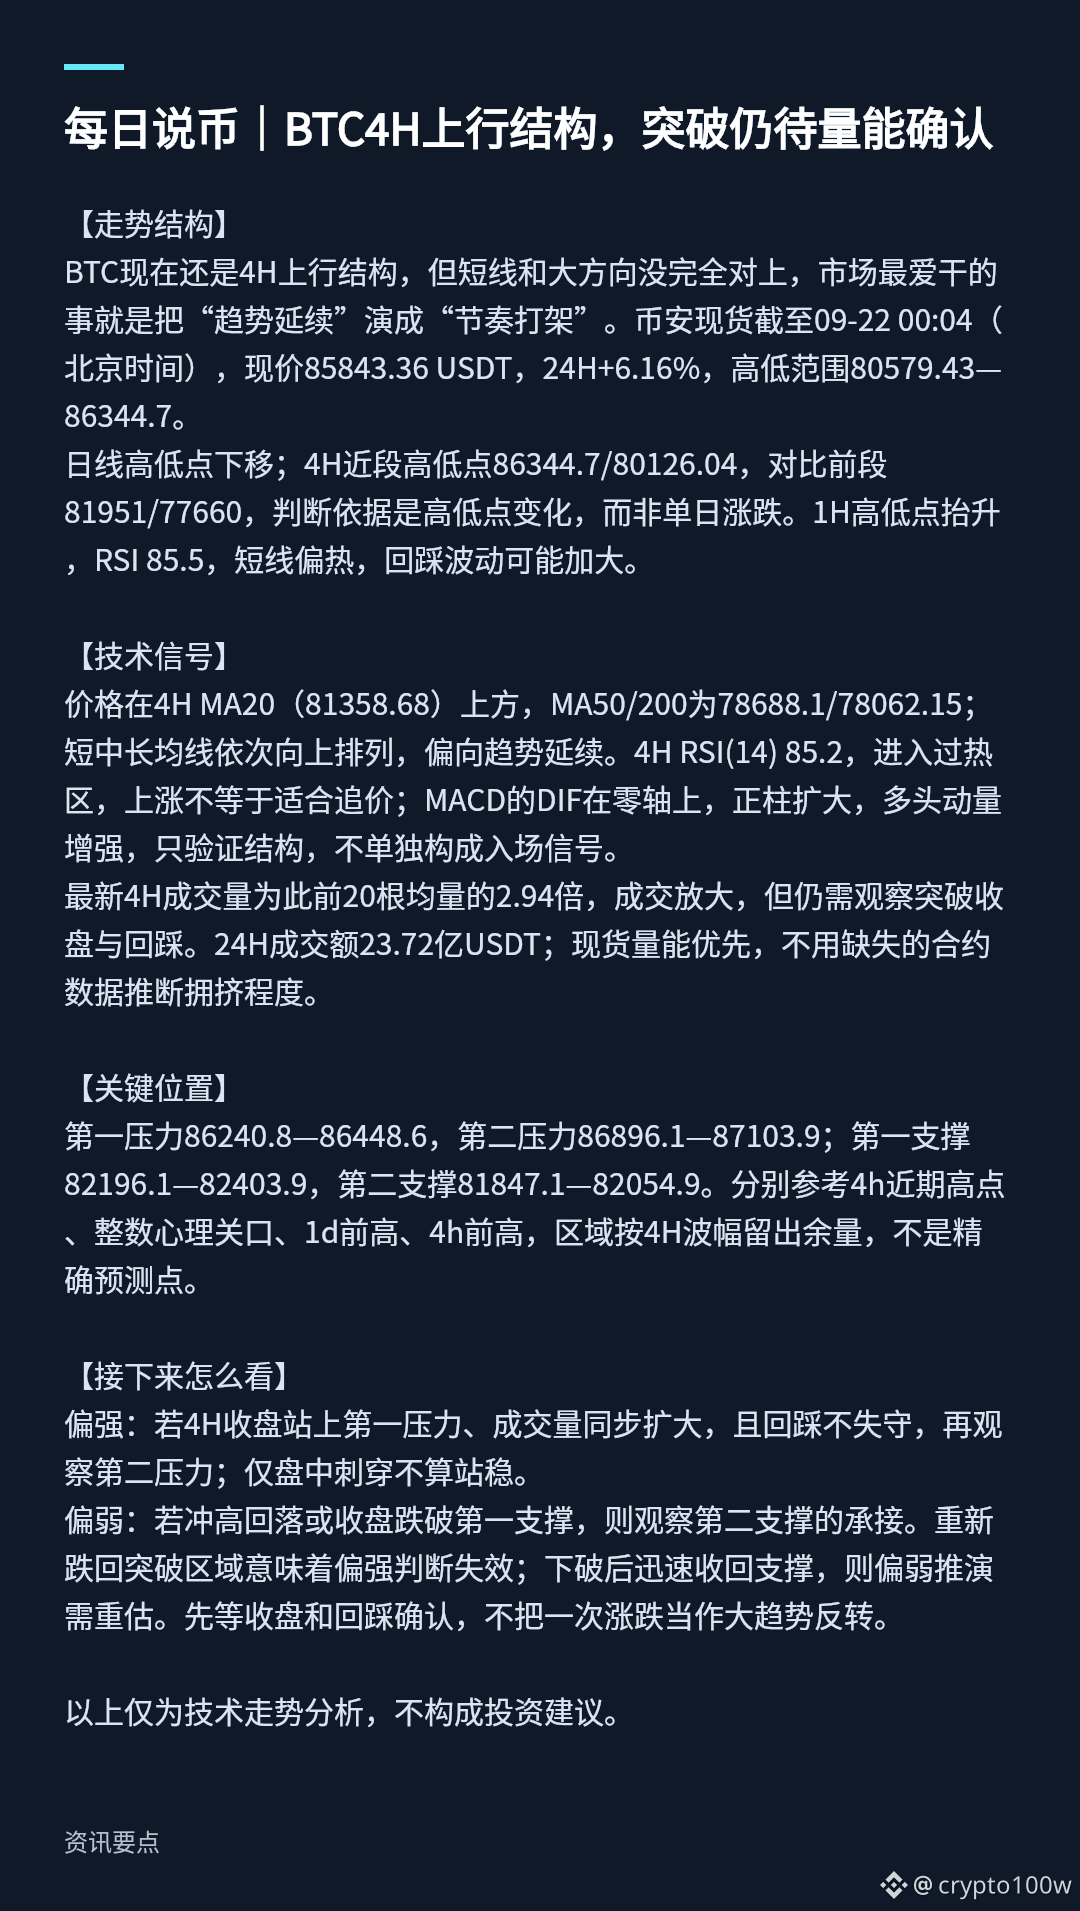
BTC is still in a 4H uptrend structure, but the short-term and the broader direction are not fully aligned. What the market loves to do is turn “trend continuation” into “rhythm conflict.” As of Binance spot 09-22 00:04 (Beijing time), the current price is 85,843.36 USDT, with a 24H change of +6.16% and a high-low range of 80,579.43—86,344.7。
The daily line’s high and low points are moving downward; in the 4H segment, the recent high/low are 86,344.7/80,126.04, compared with the prior segment’s 81,951/77,660. The basis is the change in highs and lows, not the day-to-day涨跌 alone. The 1H highs and lows are rising; RSI is 85.5, indicating the short term is overheated, so pullback fluctuations may increase.
【Technical Signals】
Price is above the 4H MA20 (81,358.68). MA50/200 are 78,688.1/78,062.15. Short-, mid-, and long-term moving averages are aligned upward in sequence, favoring trend continuation. 4H RSI(14) is 85.2, entering the overbought area. An up move does not necessarily mean it is suitable to chase. MACD’s DIF is on the zero axis; the positive histogram expands, boosting bullish momentum. It only validates structure, not as a standalone entry signal.
The latest 4H trading volume is 2.94 times the average volume of the previous 20 candles—volume has expanded. However, you still need to watch for the close after a breakout and any subsequent pullback. 24H trading amount is 2.372 billion USDT; spot volume should be prioritized—don’t infer crowding from missing futures/contract data.
【Key Levels】
First resistance: 86,240.8—86,448.6; second resistance: 86,896.1—87,103.9. First support: 82,196.1—82,403.9; second support: 81,847.1—82,054.9. Reference respectively: recent 4H highs, psychological whole-number levels, the prior 1D high, and the prior 4H high. The zones leave room based on the 4H swing range, not precise prediction points.
【How to Look Next】
More bullish: If the 4H closes above the first resistance with volume expanding in sync, and the pullback does not break down, then watch the second resistance afterward. Intraday spikes alone do not count as holding.
More bearish: If the market spikes up and then falls back, or if the close breaks below the first support, then watch how the second support holds. Falling back into the breakout zone means the bullish assumption is invalid. After a breakdown, if support is quickly reclaimed, the bearish scenario needs to be re-evaluated. Wait for confirmation from the close and the pullback; don’t treat a single rise/fall as a major trend reversal.
The above is for technical trend analysis only and does not constitute investment advice.
BTC is still in a 4H uptrend structure, but the short-term and the broader direction are not fully aligned. What the market loves to do is turn “trend continuation” into “rhythm conflict.” As of Binance spot 09-22 00:04 (Beijing time), the current price is 85,843.36 USDT, with a 24H change of +6.16% and a high-low range of 80,579.43—86,344.7。
The daily line’s high and low points are moving downward; in the 4H segment, the recent high/low are 86,344.7/80,126.04, compared with the prior segment’s 81,951/77,660. The basis is the change in highs and lows, not the day-to-day涨跌 alone. The 1H highs and lows are rising; RSI is 85.5, indicating the short term is overheated, so pullback fluctuations may increase.
【Technical Signals】
Price is above the 4H MA20 (81,358.68). MA50/200 are 78,688.1/78,062.15. Short-, mid-, and long-term moving averages are aligned upward in sequence, favoring trend continuation. 4H RSI(14) is 85.2, entering the overbought area. An up move does not necessarily mean it is suitable to chase. MACD’s DIF is on the zero axis; the positive histogram expands, boosting bullish momentum. It only validates structure, not as a standalone entry signal.
The latest 4H trading volume is 2.94 times the average volume of the previous 20 candles—volume has expanded. However, you still need to watch for the close after a breakout and any subsequent pullback. 24H trading amount is 2.372 billion USDT; spot volume should be prioritized—don’t infer crowding from missing futures/contract data.
【Key Levels】
First resistance: 86,240.8—86,448.6; second resistance: 86,896.1—87,103.9. First support: 82,196.1—82,403.9; second support: 81,847.1—82,054.9. Reference respectively: recent 4H highs, psychological whole-number levels, the prior 1D high, and the prior 4H high. The zones leave room based on the 4H swing range, not precise prediction points.
【How to Look Next】
More bullish: If the 4H closes above the first resistance with volume expanding in sync, and the pullback does not break down, then watch the second resistance afterward. Intraday spikes alone do not count as holding.
More bearish: If the market spikes up and then falls back, or if the close breaks below the first support, then watch how the second support holds. Falling back into the breakout zone means the bullish assumption is invalid. After a breakdown, if support is quickly reclaimed, the bearish scenario needs to be re-evaluated. Wait for confirmation from the close and the pullback; don’t treat a single rise/fall as a major trend reversal.
The above is for technical trend analysis only and does not constitute investment advice.