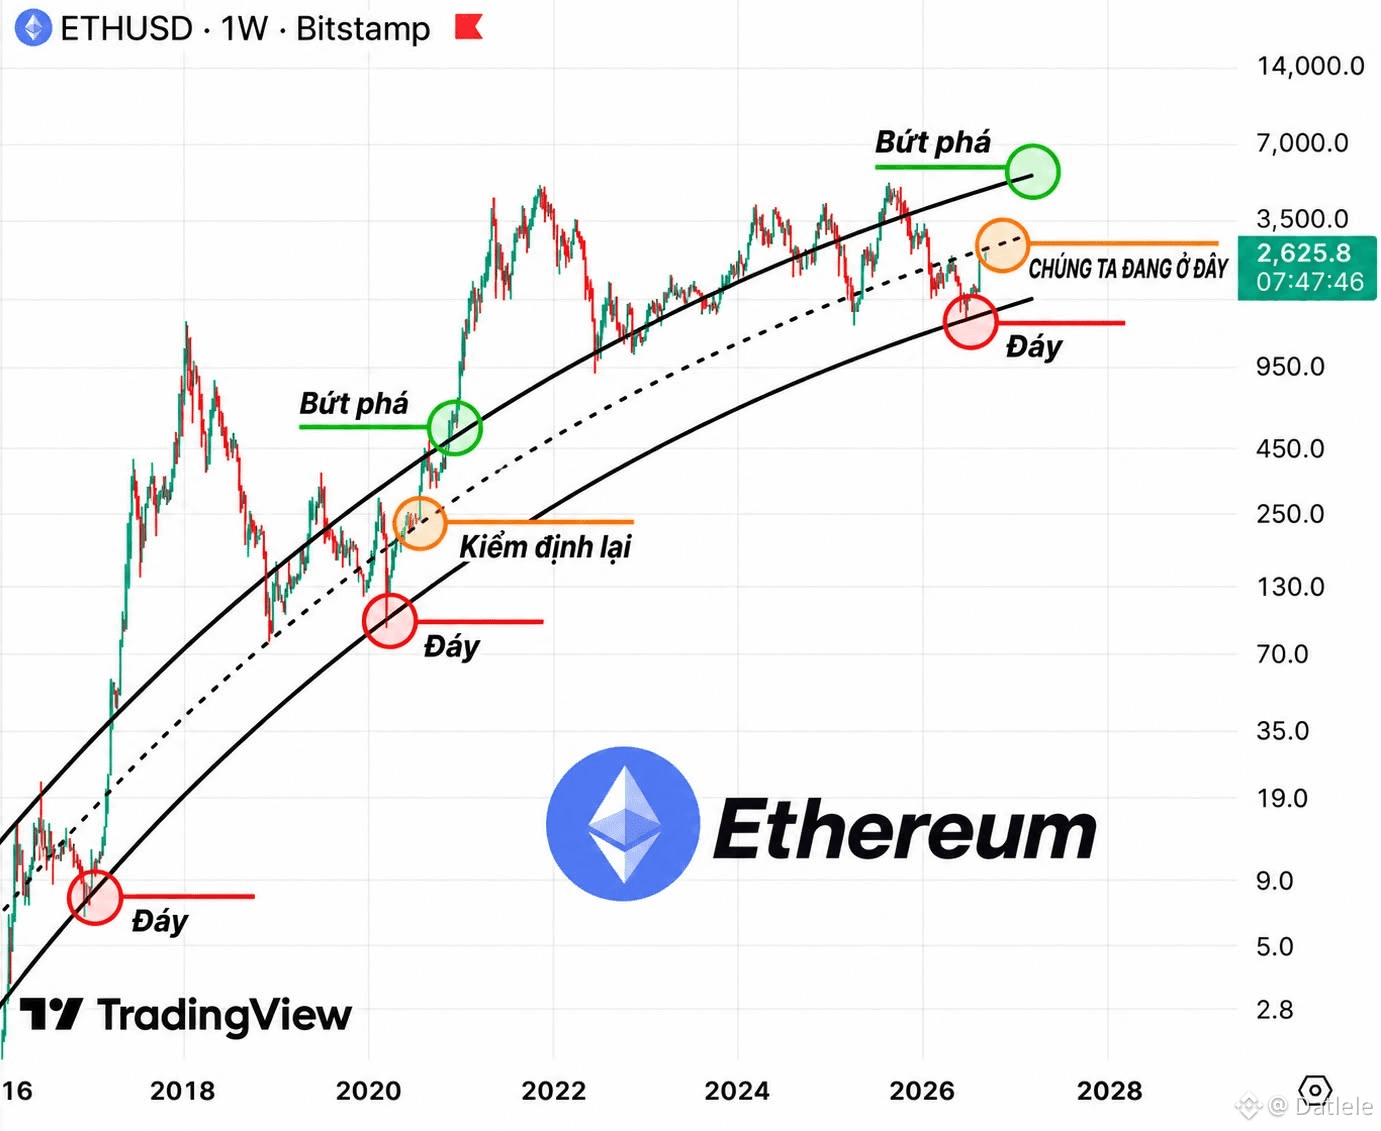
🚨STOP AND LOOK AT THIS ETH CHART
The current structure looks very familiar:
Bottom → Retest → Breakout
This same pattern has appeared before during Ethereum’s two major bullish waves.
The scenario being watched:
$2,600 holds strong → $3,000 → $7,000 → $10,000+
ETH has accumulated and built structure over a long period of time. If the $2,600 zone continues to be defended, this could be the opening phase of a new bullish cycle.
Save the chart and come back to verify later.
⚠️This content is for reference only and not financial advice.
#ETH
The current structure looks very familiar:
Bottom → Retest → Breakout
This same pattern has appeared before during Ethereum’s two major bullish waves.
The scenario being watched:
$2,600 holds strong → $3,000 → $7,000 → $10,000+
ETH has accumulated and built structure over a long period of time. If the $2,600 zone continues to be defended, this could be the opening phase of a new bullish cycle.
Save the chart and come back to verify later.
⚠️This content is for reference only and not financial advice.
#ETH