#Fetch_ai
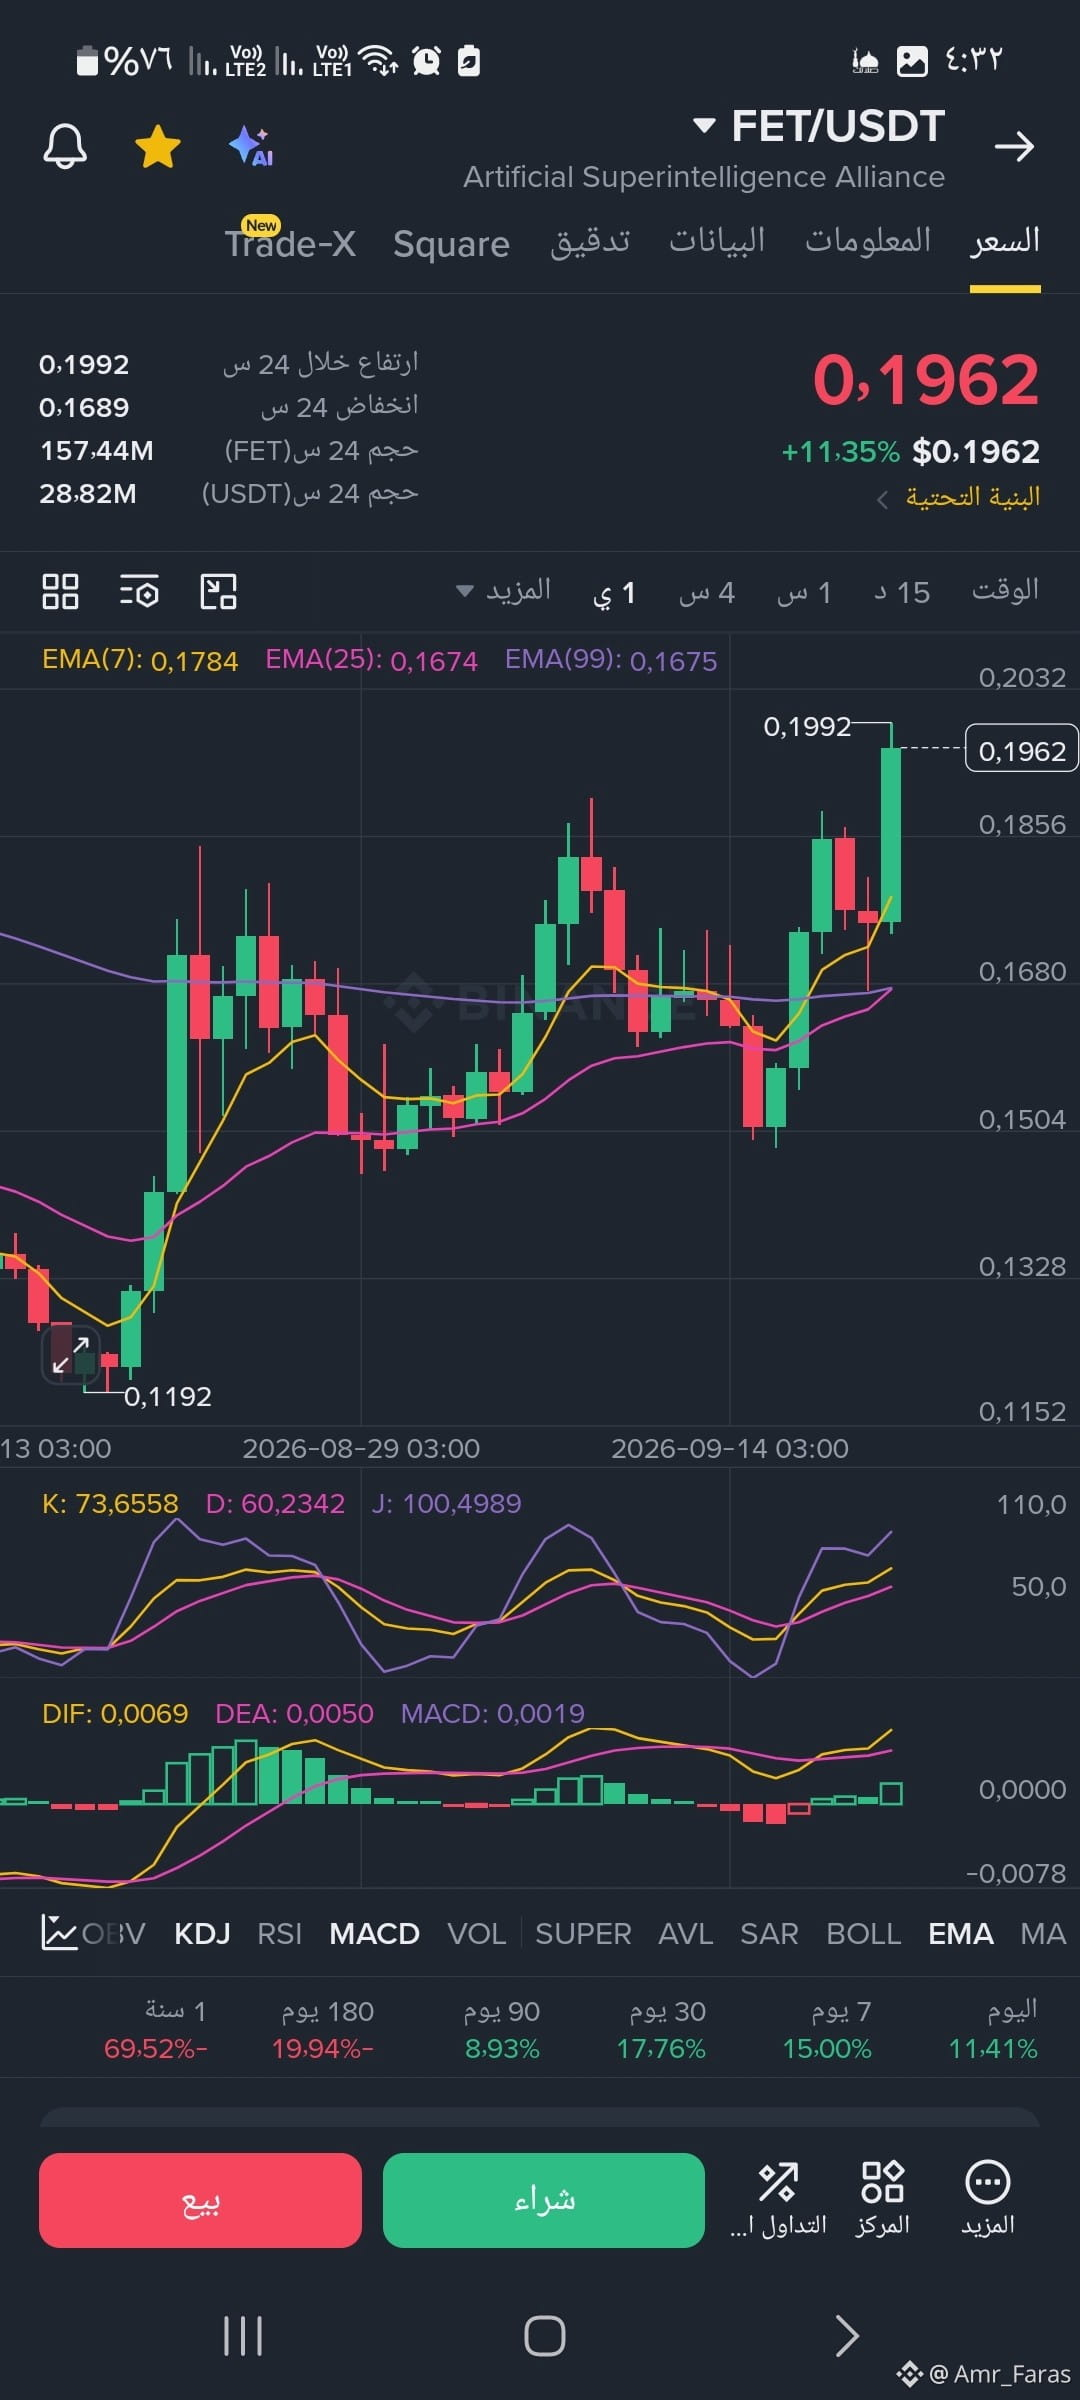
...Exponential Moving Averages (EMA)Positive Setup: The EMA(7) line, shown in yellow, is at the 0.1784 level and is trading above the EMA(25) line at 0.1674 and the EMA(99) line at 0.1675.Technical Significance: This arrangement (the fast average above the slow averages) confirms that buyers are currently in control. As long as the price remains stable above these averages, the uptrend remains intact. The moving-average zones (between 0.1670 and 0.1780) are considered excellent dynamic support areas in case of a pullback
.... Analysis of Momentum and LiquidityThe KDJ indicator (in the middle section):The current readings are very high: K: 73.65, D: 60.23, J: 100.49.Interpretation: The J line reaching the specified value reflects that the price has moved into overbought (Overbought) territory historically, when the J line pushes above the 100 level, it alerts traders to the possibility of a cooldown or corrective pullback due to profit-taking.The MACD indicator (in the lower section):The indicator shows a bullish upward crossover, with the DIF line (0.0069) moving above the DEA line (0.0050).Interpretation: The green histogram bars are moving in the positive zone above the zero line, confirming that buying momentum is still supported by the inflow of liquidity into the currency.
...Exponential Moving Averages (EMA)Positive Setup: The EMA(7) line, shown in yellow, is at the 0.1784 level and is trading above the EMA(25) line at 0.1674 and the EMA(99) line at 0.1675.Technical Significance: This arrangement (the fast average above the slow averages) confirms that buyers are currently in control. As long as the price remains stable above these averages, the uptrend remains intact. The moving-average zones (between 0.1670 and 0.1780) are considered excellent dynamic support areas in case of a pullback
.... Analysis of Momentum and LiquidityThe KDJ indicator (in the middle section):The current readings are very high: K: 73.65, D: 60.23, J: 100.49.Interpretation: The J line reaching the specified value reflects that the price has moved into overbought (Overbought) territory historically, when the J line pushes above the 100 level, it alerts traders to the possibility of a cooldown or corrective pullback due to profit-taking.The MACD indicator (in the lower section):The indicator shows a bullish upward crossover, with the DIF line (0.0069) moving above the DEA line (0.0050).Interpretation: The green histogram bars are moving in the positive zone above the zero line, confirming that buying momentum is still supported by the inflow of liquidity into the currency.