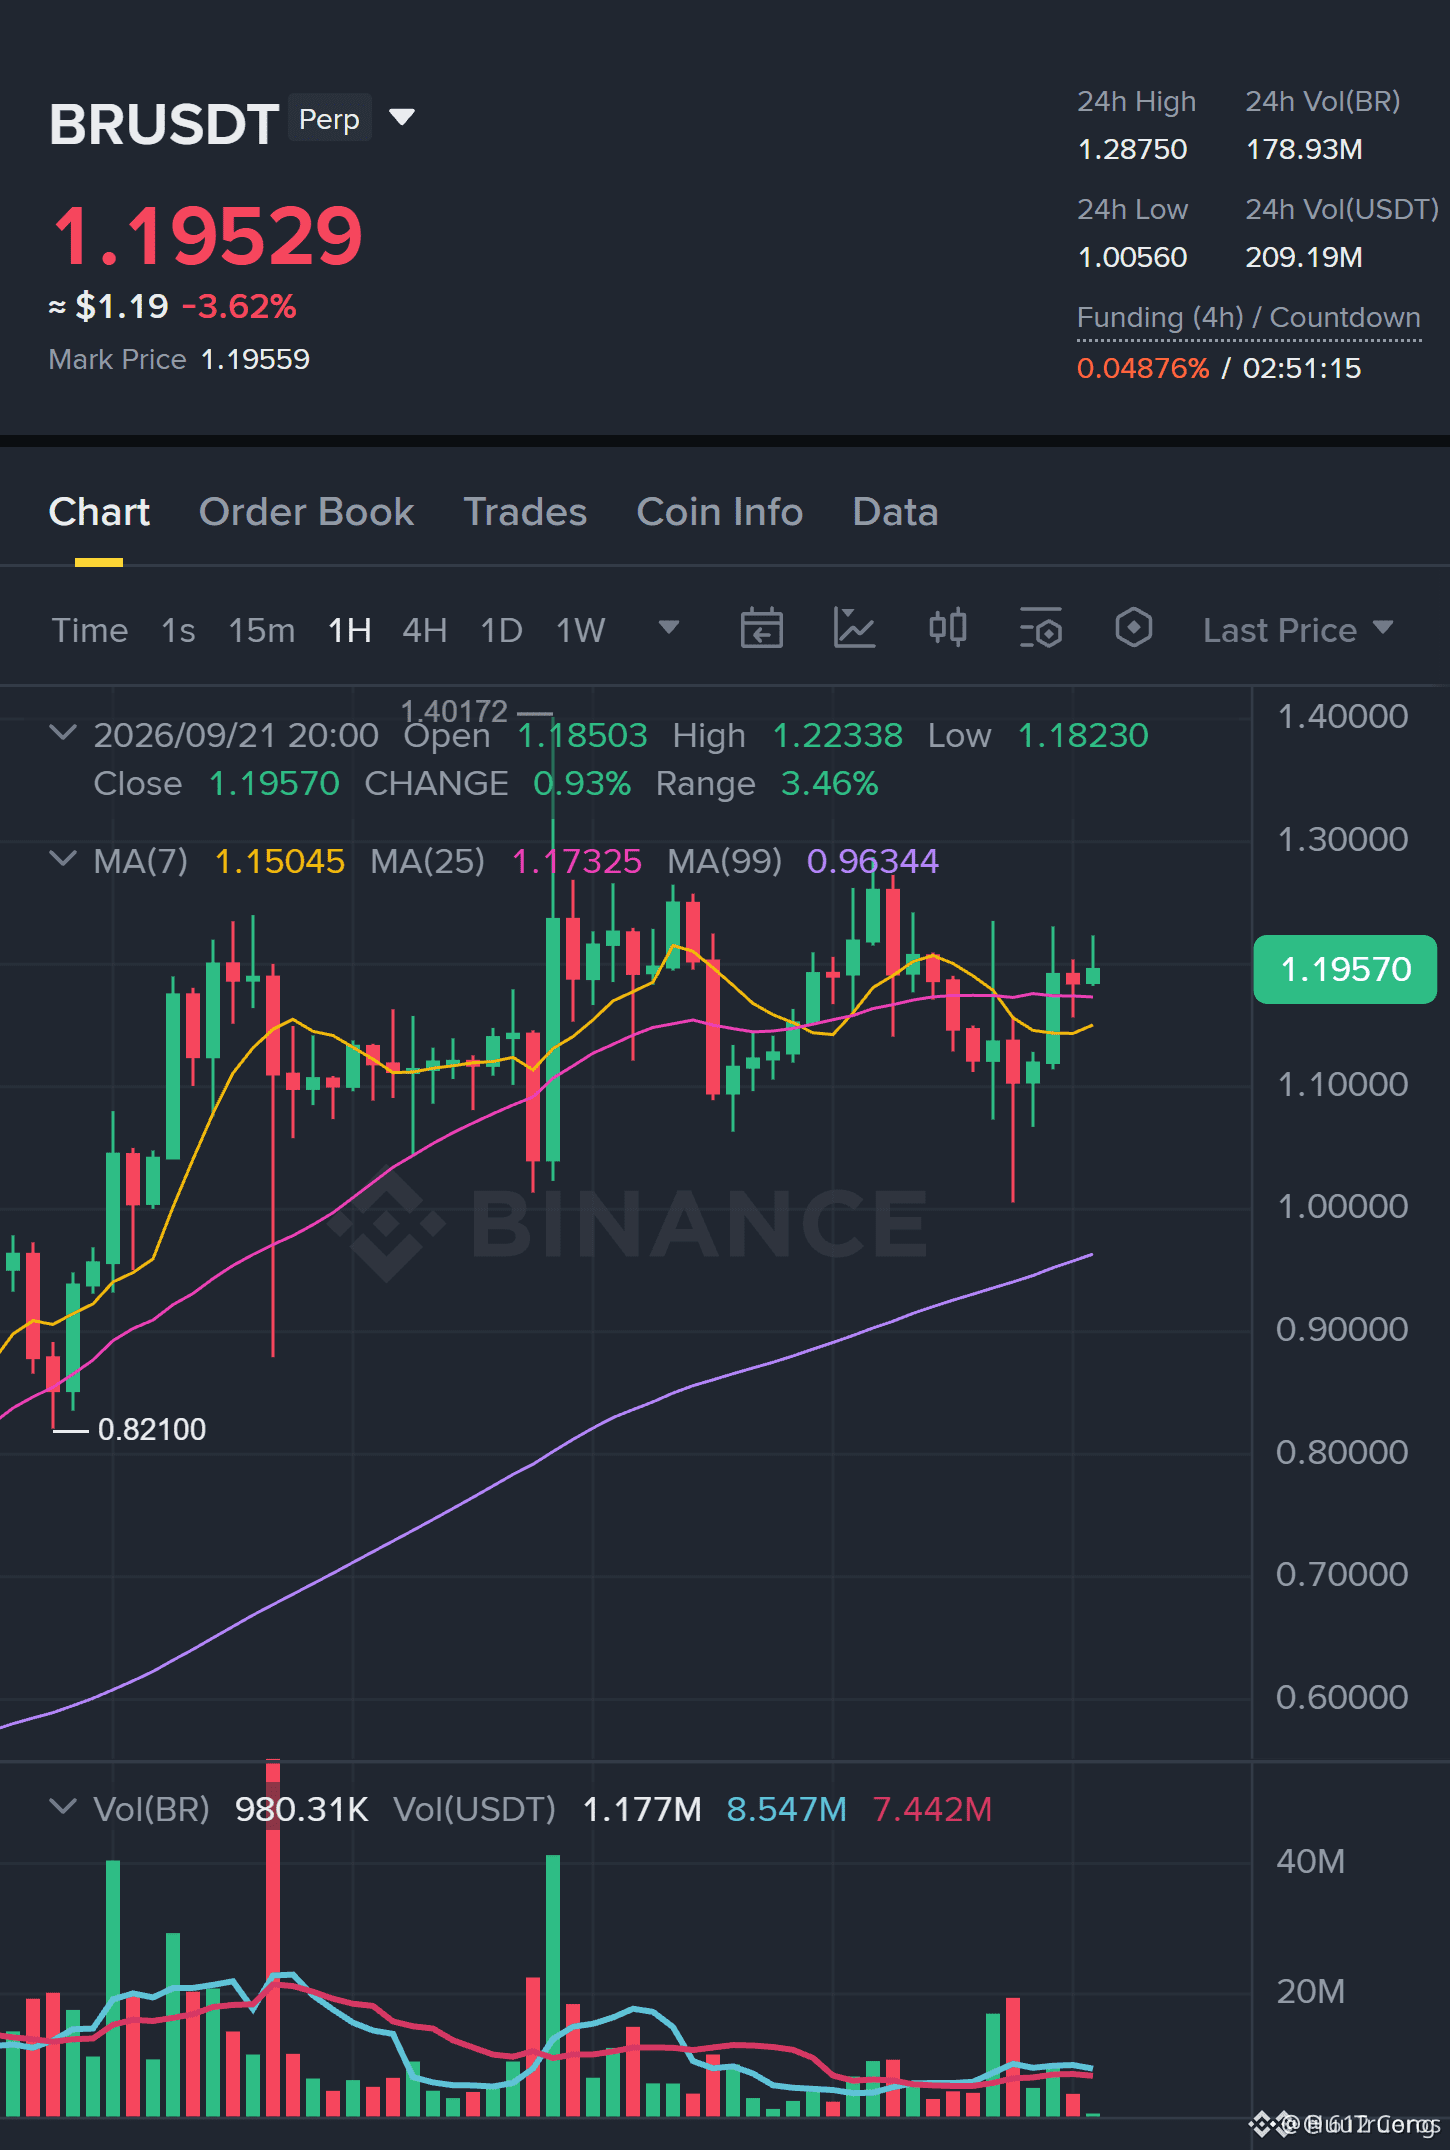
Most traders miss the BR when the daily chart structure (daily stack) is already bullish.
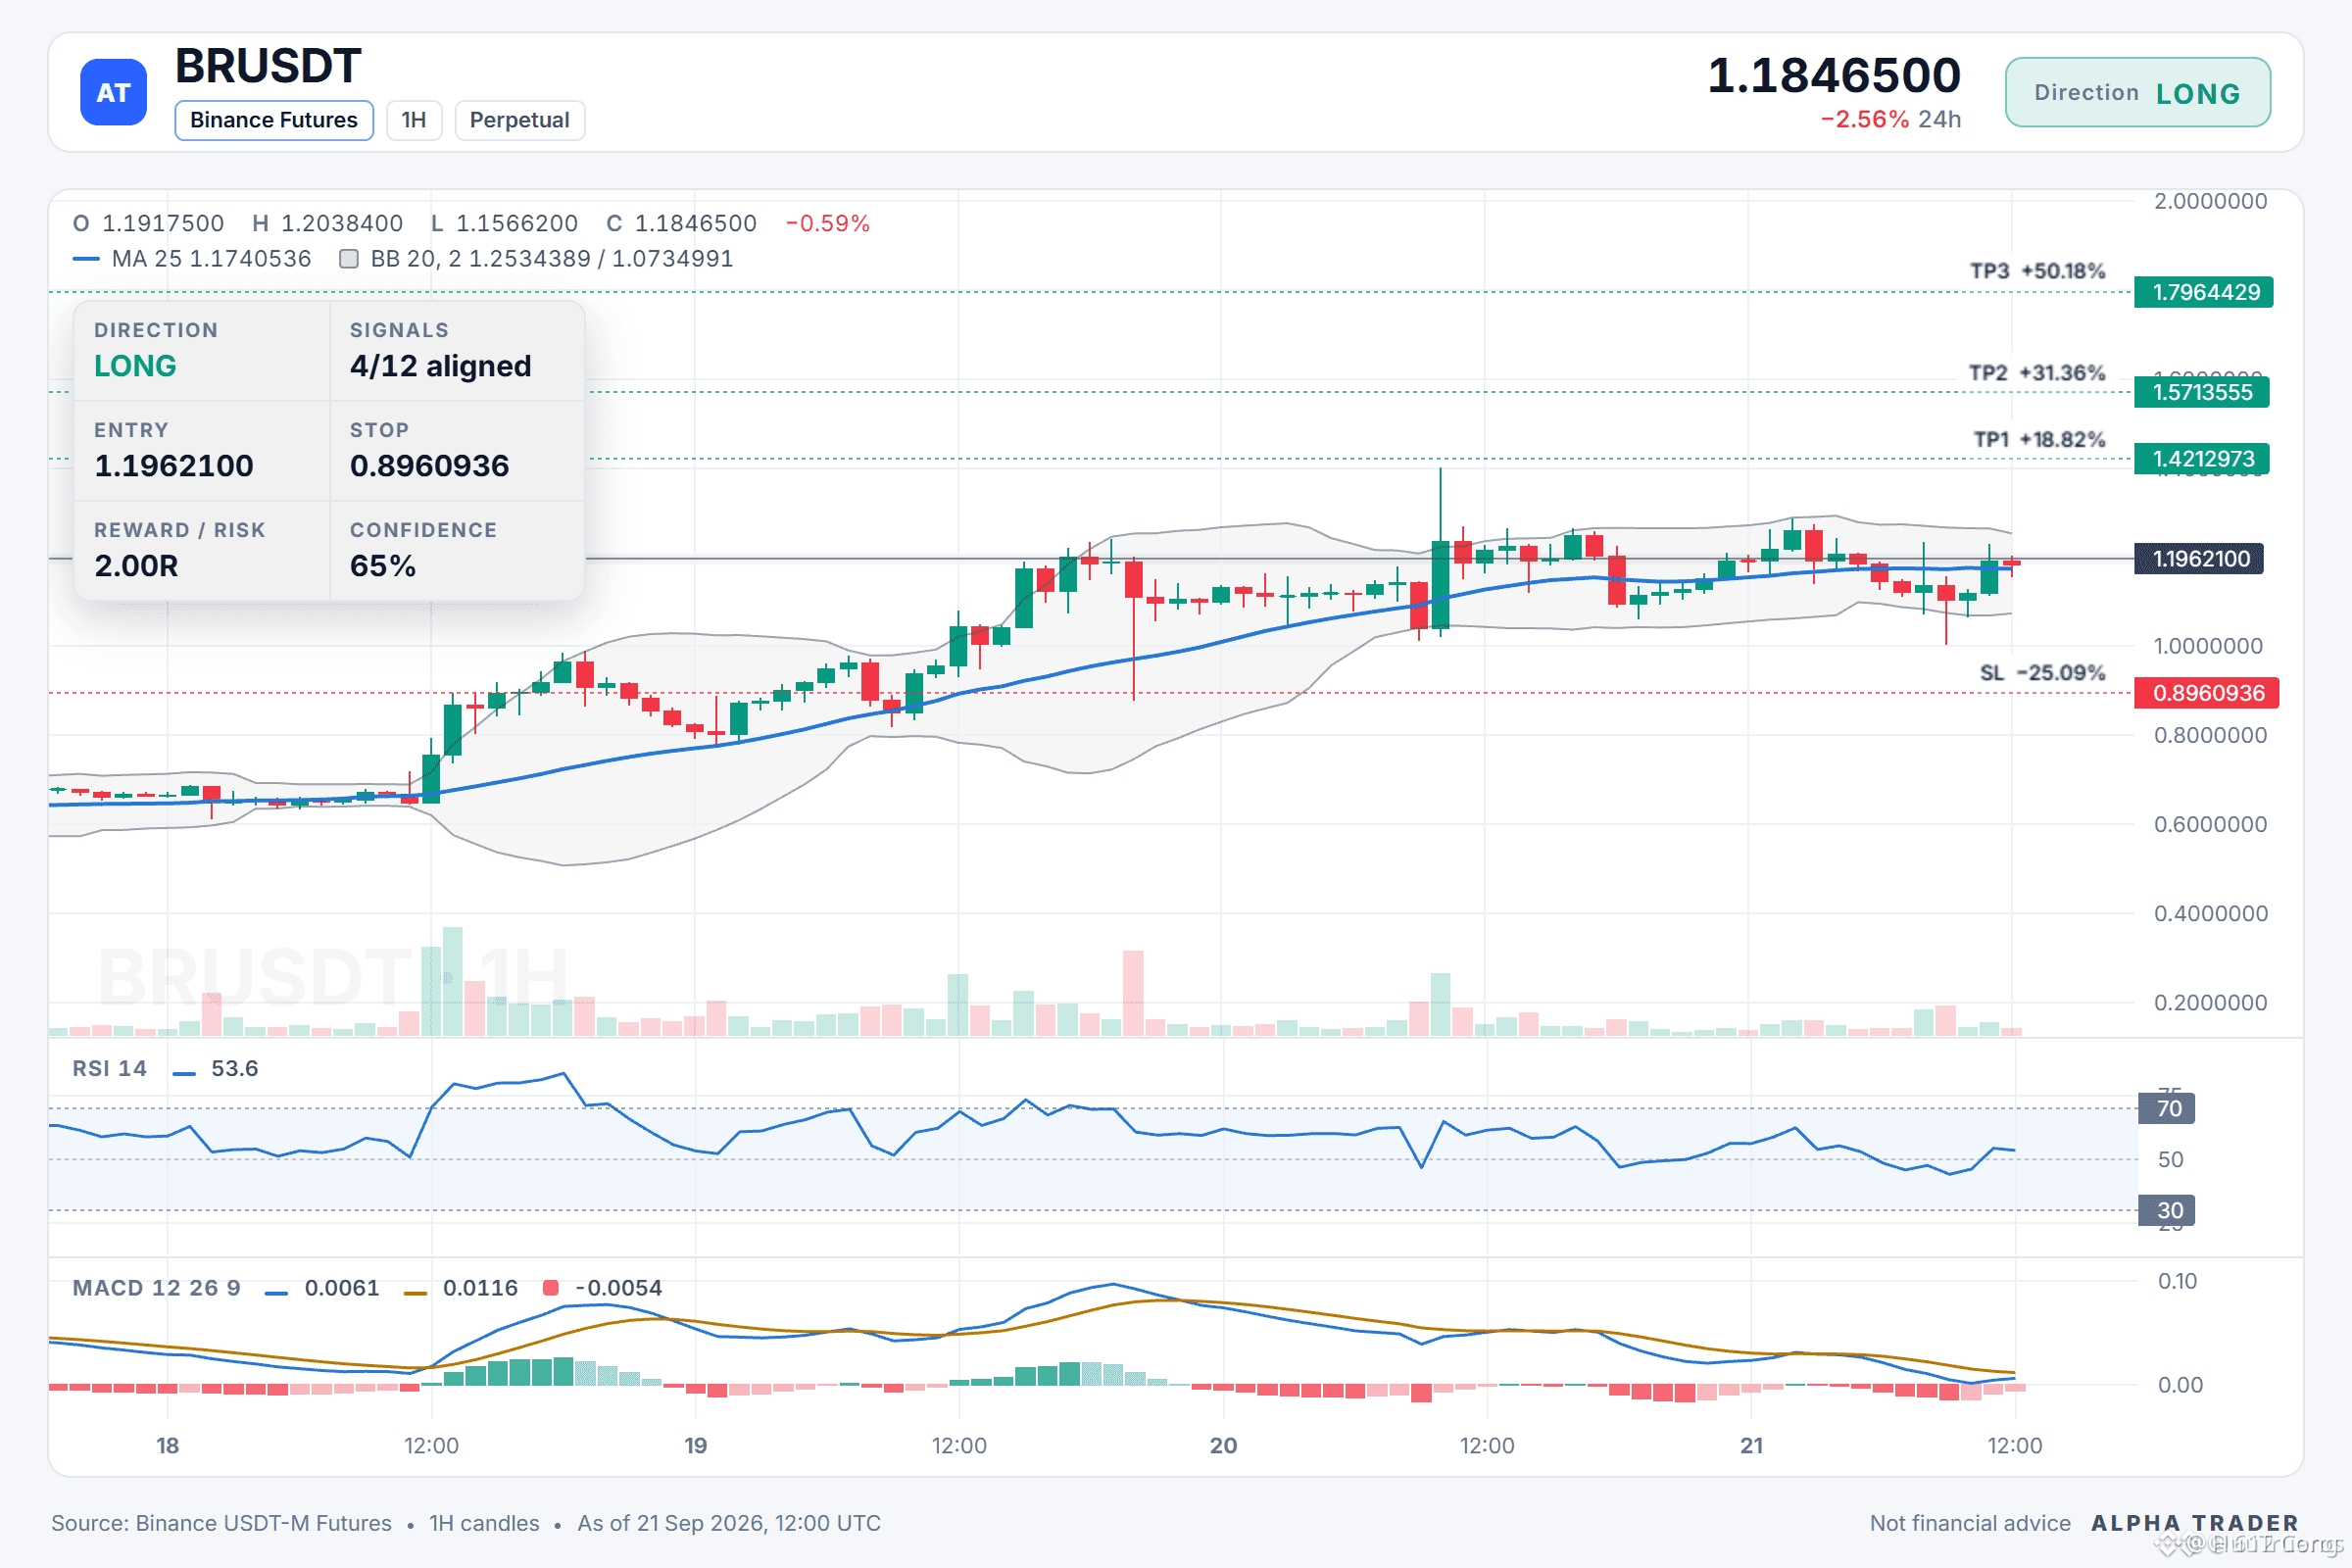
📊 $BR /USDT · Trend: LONG (Inclined) · 4/12 consensus signals
⚠️ The setup is inclined, not a high-confidence type: there is still 1 opposing signal. Consider an appropriate position size.
Technical conclusion: INCLINED TOWARD LONG. 4/12 consensus signals, 1 contrary signal.
What supports (4):
• Daily trend: price > EMA50 > EMA200, bullish structure
• 4h trend: price > EMA50 > EMA200, bullish structure
• 1h trend: price > EMA50 > EMA200, bullish structure
• 4h RSI: 67.2, upward momentum (above 55)
What contradicts (1):
• Relative strength vs BTC: underperforming, −9.69% vs BTC over the past day
Price map:
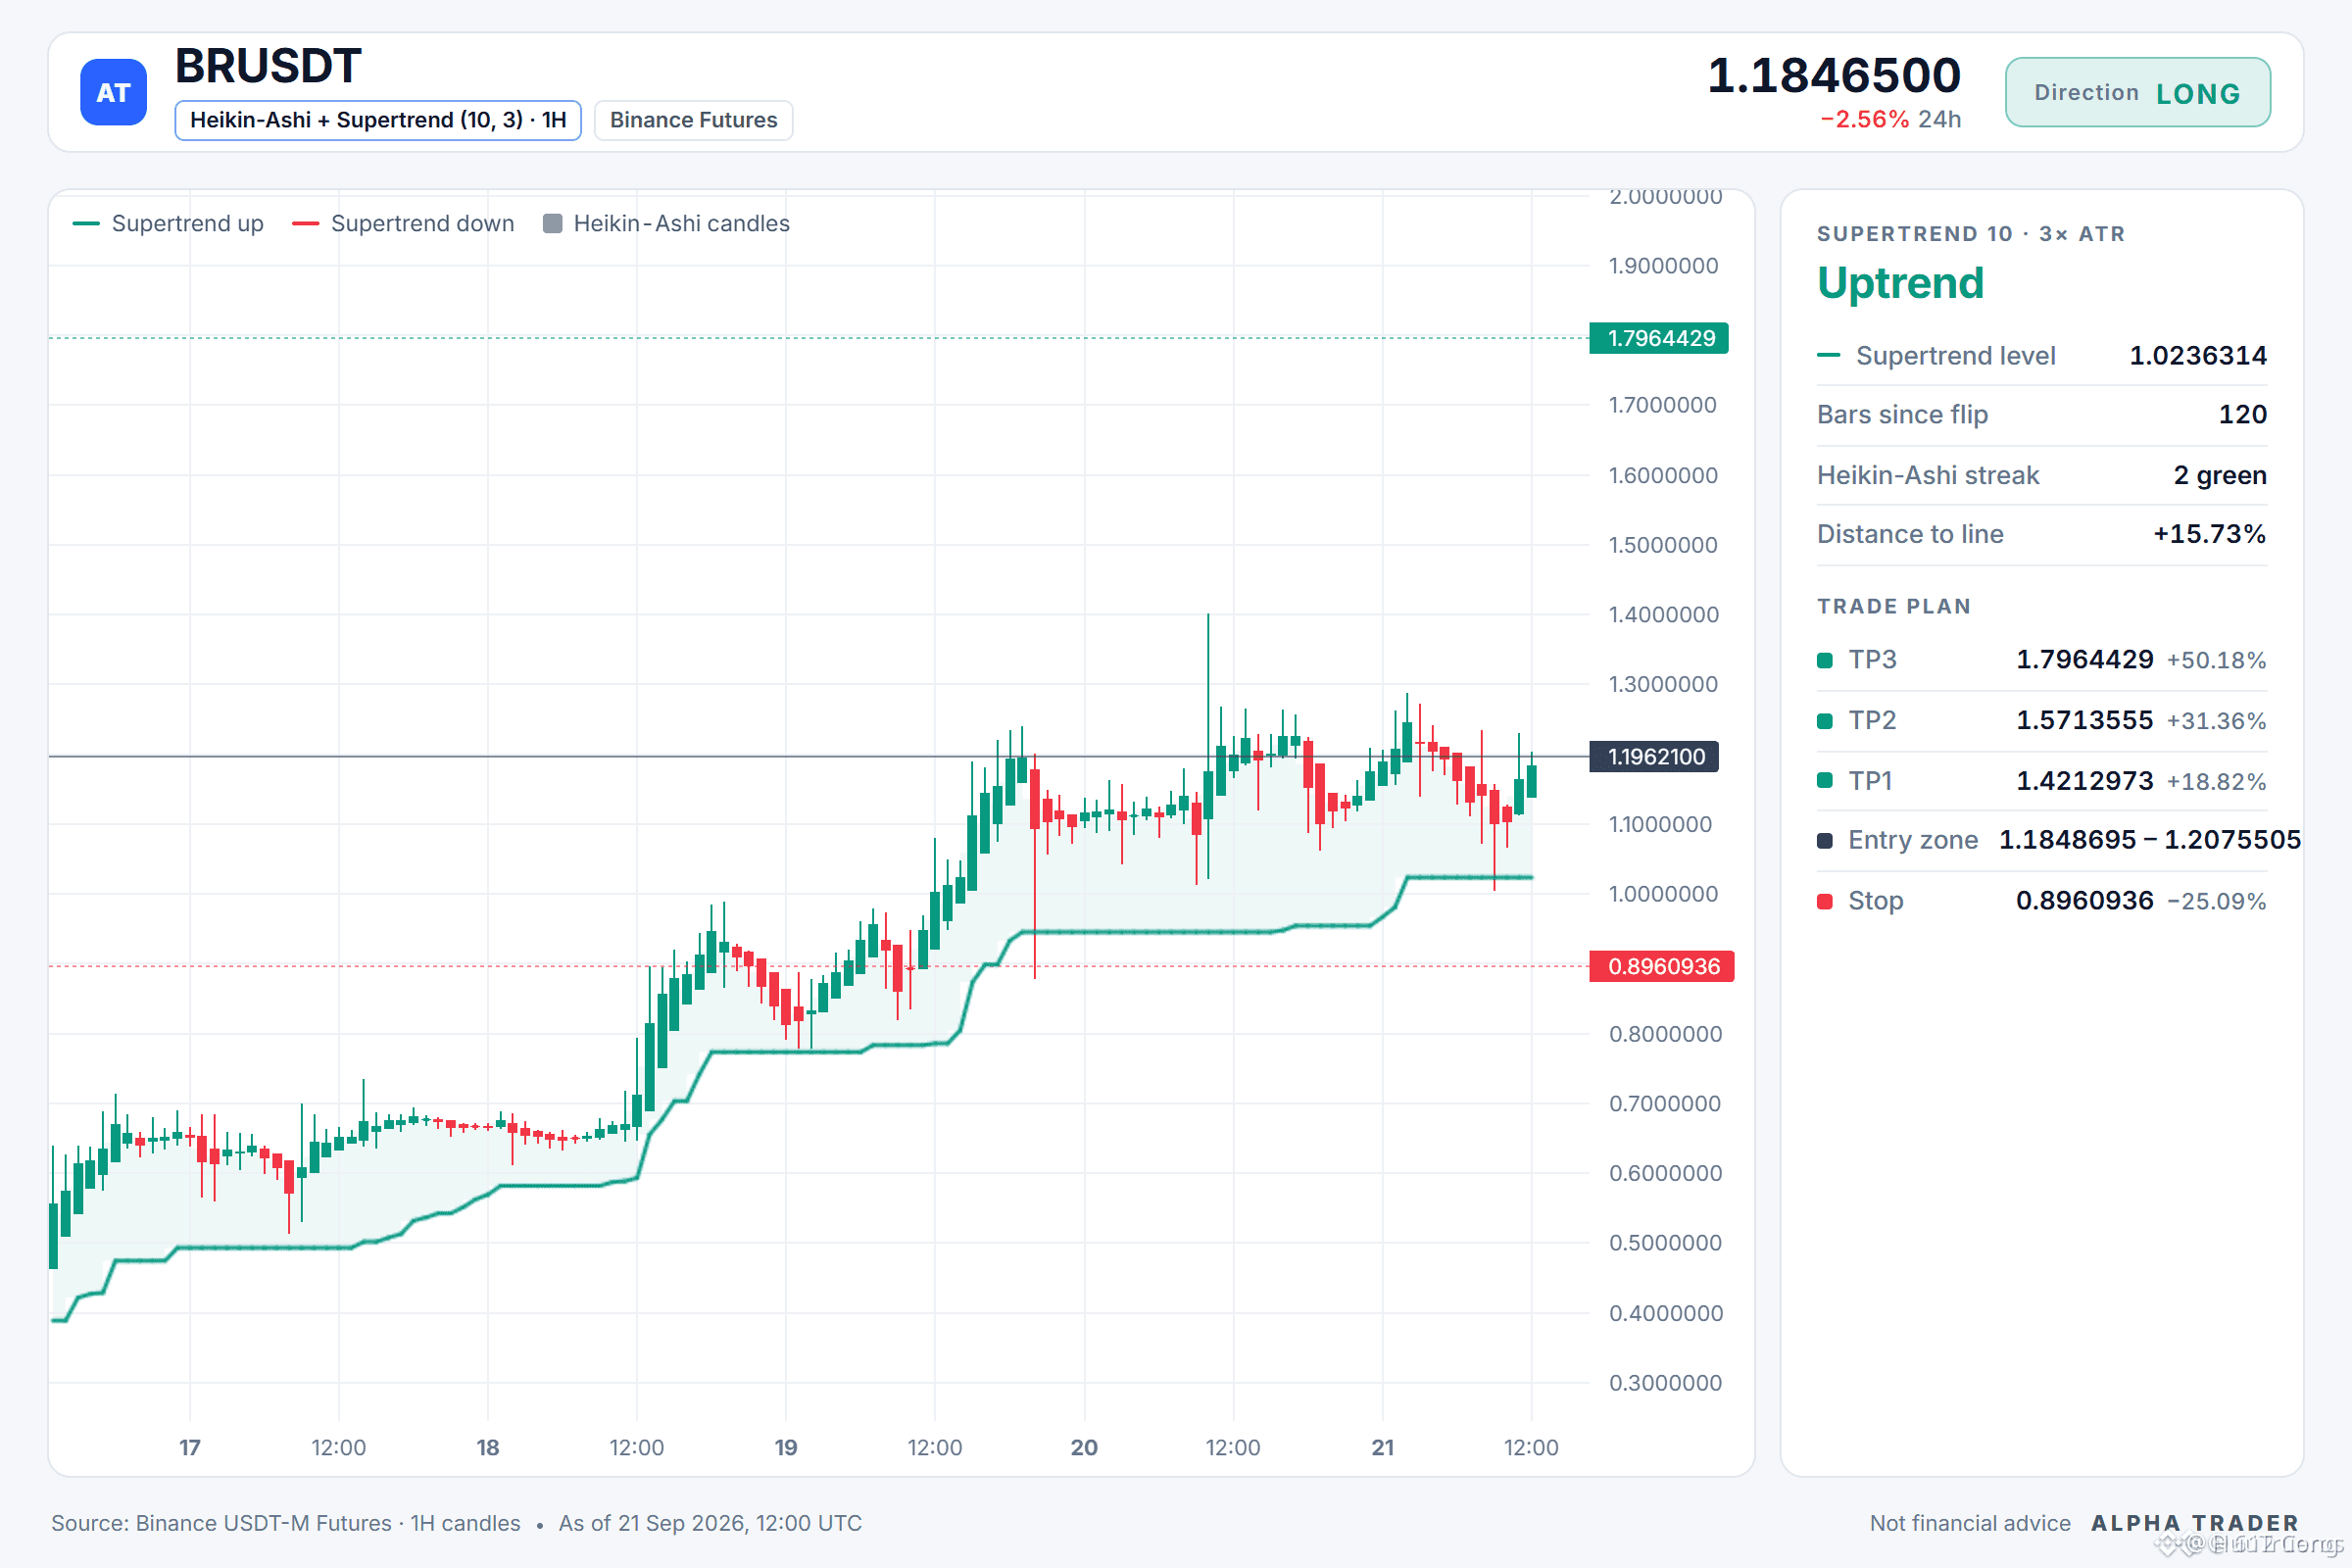
🎯 TP3: 1.7964429
🎯 TP2: 1.5713555
🎯 TP1: 1.4212973
📍 Entry: 1.1848695 – 1.2075505
🛑 Stop loss (SL): 0.8960936
🟢 Upside scenario:
The 1h chart price is at 1.1962100, within the entry zone; the daily trend is bullish and the 4h structure is overlapping (stacked). From the entry zone, BR will push up toward TP1 at 1.4212973, then expand to TP2 at 1.5713555 when the 4h RSI is 67.2, showing bullish momentum.
🛑 What would break this scenario:
A failed setup if BR drops below the invalidation threshold at 0.7023645—this level would also invalidate the overlapping EMA structure, and I will close the position at SL 0.8960936.
💬 Where would you place the BR stop for the LONG order relative to the invalidation level 0.7023645?
Chart with all key levels 👇
⚠️ This is just my personal market analysis. NFA — manage risk and do your own research (DYOR).
Educational content only, not investment advice or a recommendation to buy, sell, deposit, or withdraw any asset. No paid promotions.
📊 $BR /USDT · Trend: LONG (Inclined) · 4/12 consensus signals
⚠️ The setup is inclined, not a high-confidence type: there is still 1 opposing signal. Consider an appropriate position size.
Technical conclusion: INCLINED TOWARD LONG. 4/12 consensus signals, 1 contrary signal.
What supports (4):
• Daily trend: price > EMA50 > EMA200, bullish structure
• 4h trend: price > EMA50 > EMA200, bullish structure
• 1h trend: price > EMA50 > EMA200, bullish structure
• 4h RSI: 67.2, upward momentum (above 55)
What contradicts (1):
• Relative strength vs BTC: underperforming, −9.69% vs BTC over the past day
Price map:
🎯 TP3: 1.7964429
🎯 TP2: 1.5713555
🎯 TP1: 1.4212973
📍 Entry: 1.1848695 – 1.2075505
🛑 Stop loss (SL): 0.8960936
🟢 Upside scenario:
The 1h chart price is at 1.1962100, within the entry zone; the daily trend is bullish and the 4h structure is overlapping (stacked). From the entry zone, BR will push up toward TP1 at 1.4212973, then expand to TP2 at 1.5713555 when the 4h RSI is 67.2, showing bullish momentum.
🛑 What would break this scenario:
A failed setup if BR drops below the invalidation threshold at 0.7023645—this level would also invalidate the overlapping EMA structure, and I will close the position at SL 0.8960936.
💬 Where would you place the BR stop for the LONG order relative to the invalidation level 0.7023645?
Chart with all key levels 👇
⚠️ This is just my personal market analysis. NFA — manage risk and do your own research (DYOR).
Educational content only, not investment advice or a recommendation to buy, sell, deposit, or withdraw any asset. No paid promotions.