📊 MONITORING OF TECHNICAL ANALYSIS FOR PURCHASE — BTCUSDT
🚀 Bitcoin (BTCUSDT) | Timeframe: 30 minutes
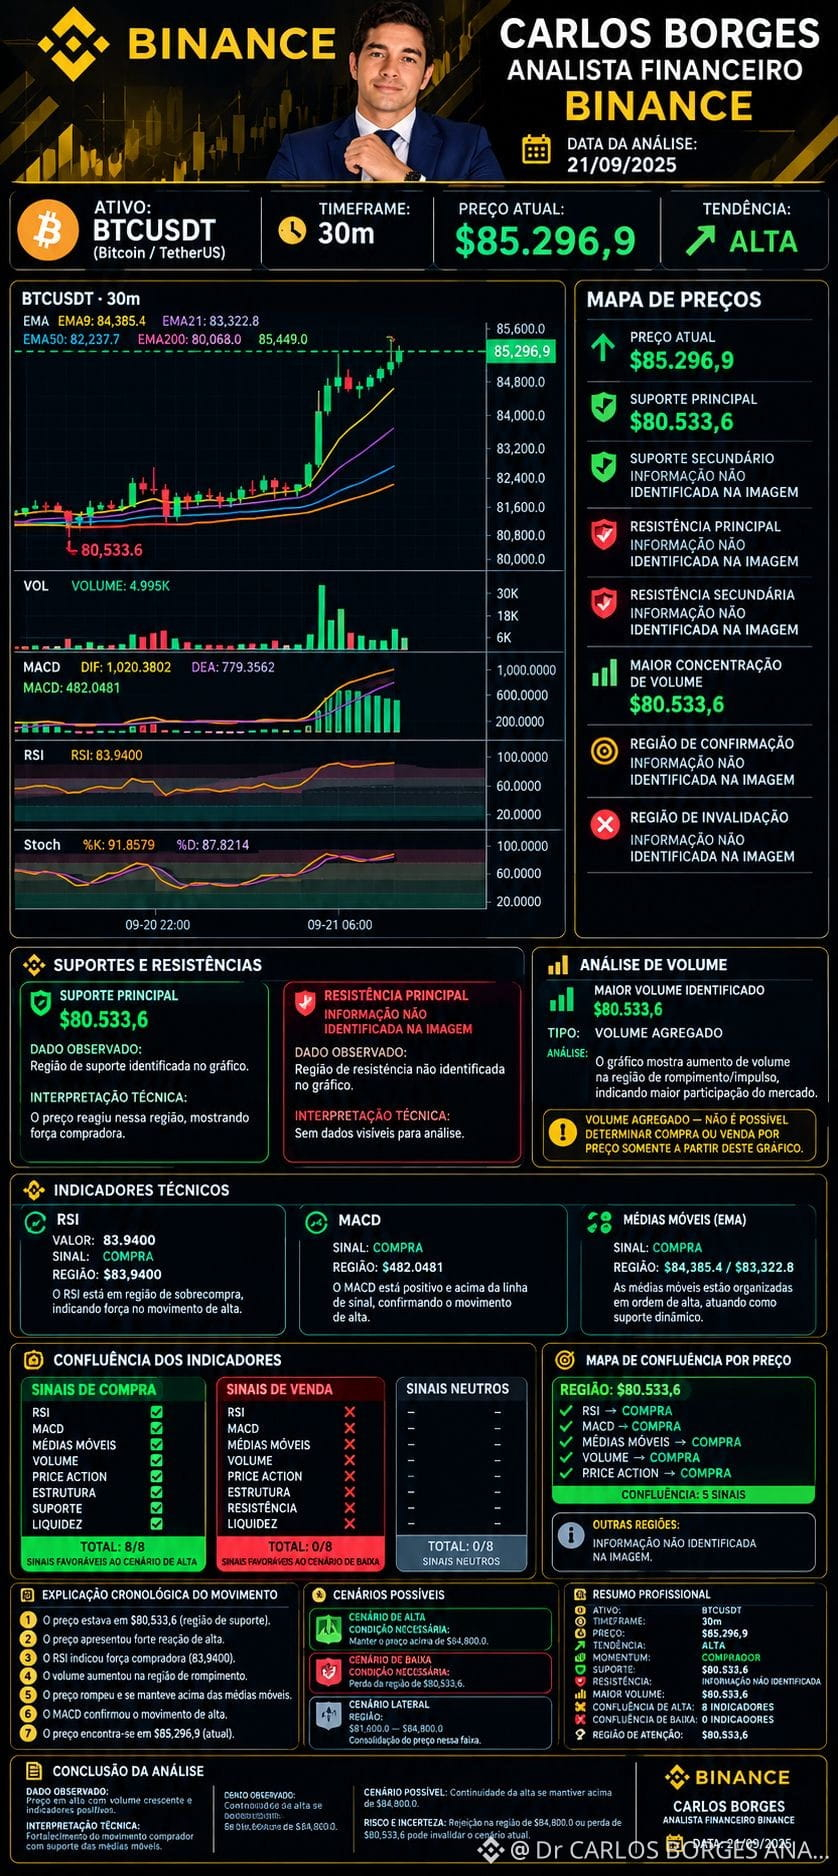
Bitcoin shows an upward move in the analyzed chart, with the price near US$ 85.296,9.
📈 Observed technical scenario:
✅ Bullish structure on the chart. ✅ Moving averages aligned with the upward movement. ✅ MACD positive, indicating strength in the move. ⚠️ RSI at 83,94, signaling an overbought region. ⚠️ Stochastic at high levels, requiring attention for possible pullbacks. 📊 Aggregate volume increased during the bullish impulse.
🎯 Points to watch:
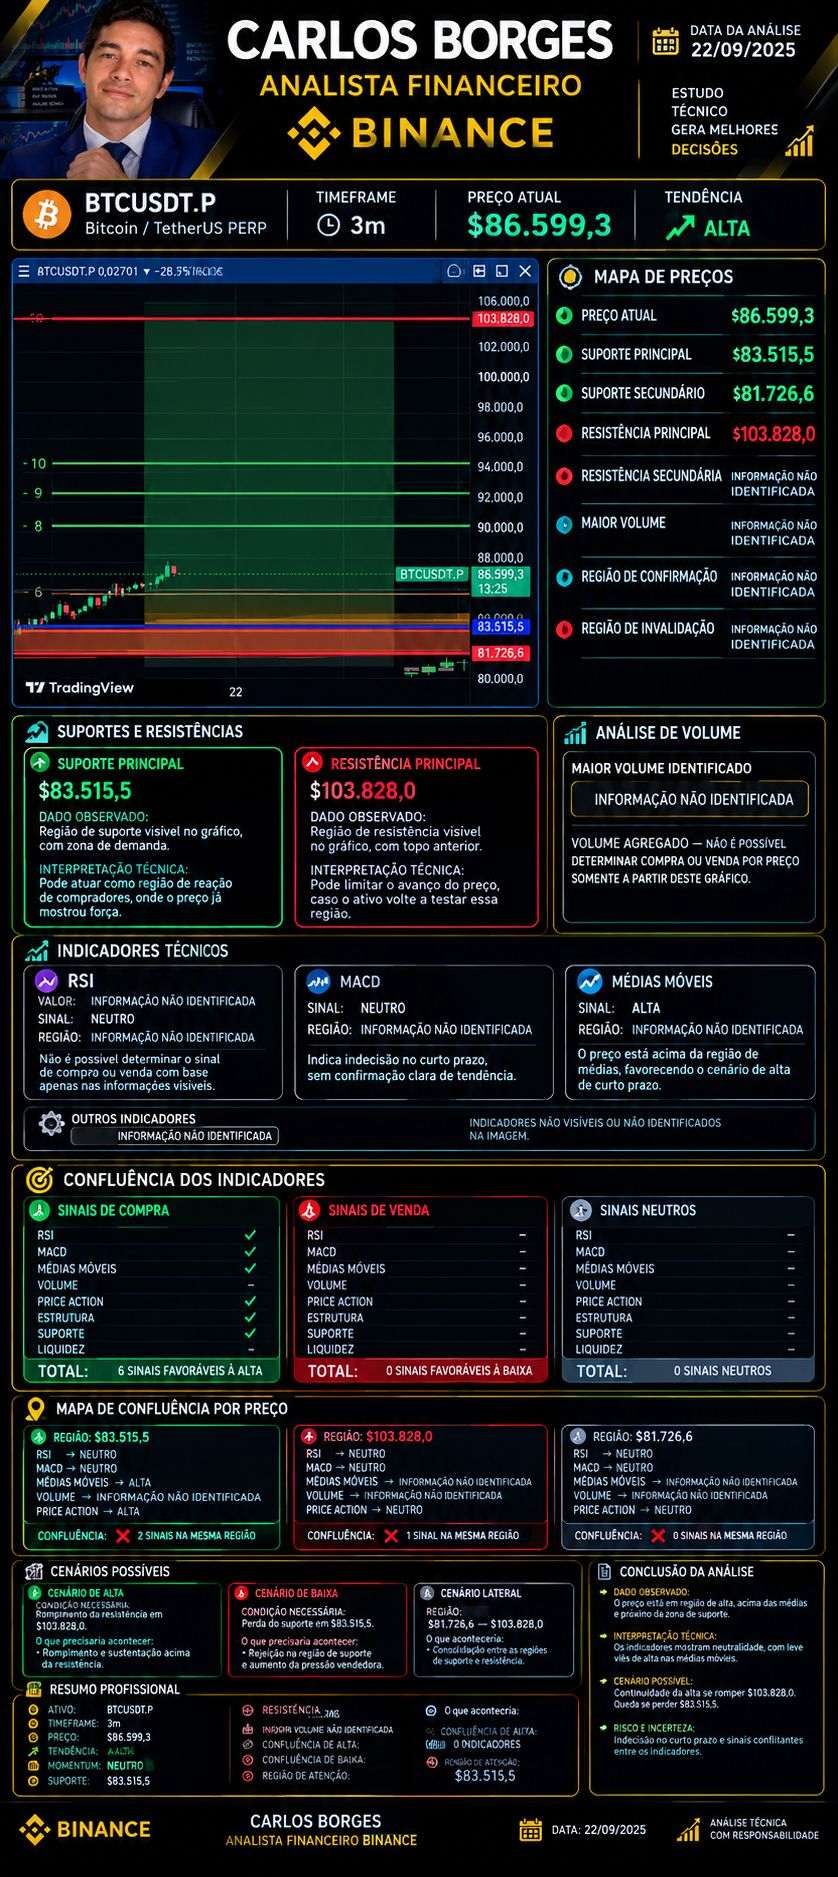
🔹 US$ 85.202,5 region: level observed on the chart for monitoring. 🔹 US$ 81.726,6: support region indicated in the analyzed structure. 🔹 US$ 95.380,1 and US$ 105.636,7: upper levels identified on the chart.
📌 Monitoring strategy:
Follow the continuation of the upward move and wait for price confirmations before considering a buy entry. Watch for possible pullbacks, reactions in the support regions, and volume behavior.
📊 CARLOS BORGES FINANCIAL ANALYST BINANCE
🚀 Bitcoin (BTCUSDT) | Timeframe: 30 minutes
Bitcoin shows an upward move in the analyzed chart, with the price near US$ 85.296,9.
📈 Observed technical scenario:
✅ Bullish structure on the chart. ✅ Moving averages aligned with the upward movement. ✅ MACD positive, indicating strength in the move. ⚠️ RSI at 83,94, signaling an overbought region. ⚠️ Stochastic at high levels, requiring attention for possible pullbacks. 📊 Aggregate volume increased during the bullish impulse.
🎯 Points to watch:
🔹 US$ 85.202,5 region: level observed on the chart for monitoring. 🔹 US$ 81.726,6: support region indicated in the analyzed structure. 🔹 US$ 95.380,1 and US$ 105.636,7: upper levels identified on the chart.
📌 Monitoring strategy:
Follow the continuation of the upward move and wait for price confirmations before considering a buy entry. Watch for possible pullbacks, reactions in the support regions, and volume behavior.
📊 CARLOS BORGES FINANCIAL ANALYST BINANCE