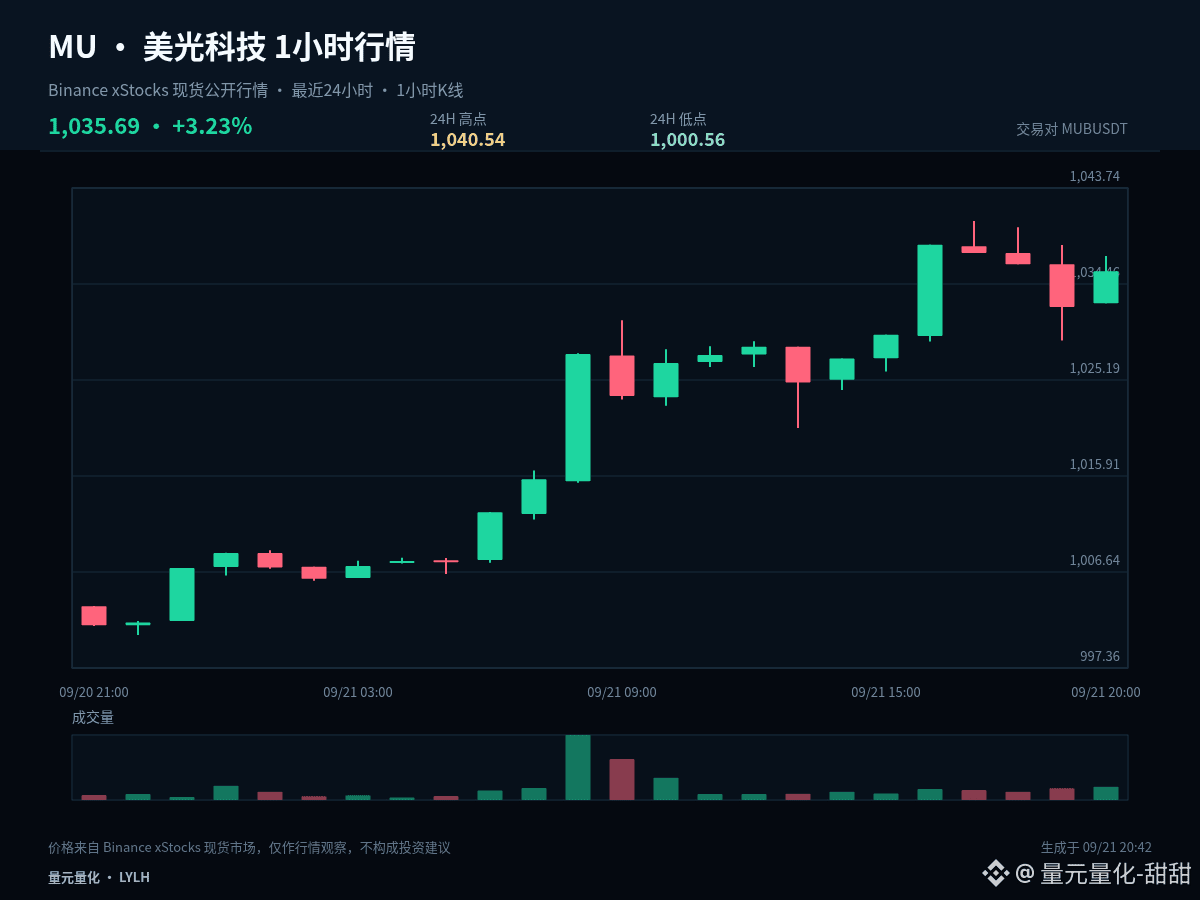
$MUB #MU Right now it looks more like range-based rotation, and you don’t need to explain every individual 1-hour candlestick as a brand-new trend. Current price: 1,035.69; 1 hour: +0.33%; 24 hours: +3.25%.
The current price is near the upper edge of the past 24-hour range: +0.33% in the last hour and +3.25% over 24 hours. The most important thing at the highs is to confirm the market’s acceptance after a breakout: if price can stay above the upper edge, it shows the market is recognizing a higher trading range. If it only briefly pierces through and then quickly snaps back, you need to guard against a false breakout.
Upper edge: 1,040.54; lower edge: 1,000.56; midline: 1,020.55. When price is near the upper edge, watch the breakout quality; near the lower edge, watch for follow-through/support. Around the midline, reduce frequent trading—because it’s not far enough from either side, the direction and risk-reward ratio are not clear.
The signals really worth acting on are: after a boundary is crossed, price is willing to stay within the new range; or after price probes the boundary downward, it quickly reclaims it. Without such confirmation, continue treating it as consolidation/oscillation—don’t let brief intraday fluctuations change the overall plan.
For existing positions, handle them in stages based on key levels, so you don’t have to make all decisions at once. For those with no position, wait for breakout confirmation or for a pullback to stabilize. For U.S. market instruments, also watch the volatility caused by session/time changes; your plan should be based on price conditions, not replaced by emotions when executing.
For short-term positions, the key is not to predict every single candlestick, but to make sure entries, trimming, and exits have clear justification. If there’s no confirmation, do less; if a key level fails, redo the plan. First control per-trade risk, then talk about potential upside/downside space.
#BOJRaisesRatesTo31YearHigh
The current price is near the upper edge of the past 24-hour range: +0.33% in the last hour and +3.25% over 24 hours. The most important thing at the highs is to confirm the market’s acceptance after a breakout: if price can stay above the upper edge, it shows the market is recognizing a higher trading range. If it only briefly pierces through and then quickly snaps back, you need to guard against a false breakout.
Upper edge: 1,040.54; lower edge: 1,000.56; midline: 1,020.55. When price is near the upper edge, watch the breakout quality; near the lower edge, watch for follow-through/support. Around the midline, reduce frequent trading—because it’s not far enough from either side, the direction and risk-reward ratio are not clear.
The signals really worth acting on are: after a boundary is crossed, price is willing to stay within the new range; or after price probes the boundary downward, it quickly reclaims it. Without such confirmation, continue treating it as consolidation/oscillation—don’t let brief intraday fluctuations change the overall plan.
For existing positions, handle them in stages based on key levels, so you don’t have to make all decisions at once. For those with no position, wait for breakout confirmation or for a pullback to stabilize. For U.S. market instruments, also watch the volatility caused by session/time changes; your plan should be based on price conditions, not replaced by emotions when executing.
For short-term positions, the key is not to predict every single candlestick, but to make sure entries, trimming, and exits have clear justification. If there’s no confirmation, do less; if a key level fails, redo the plan. First control per-trade risk, then talk about potential upside/downside space.
#BOJRaisesRatesTo31YearHigh