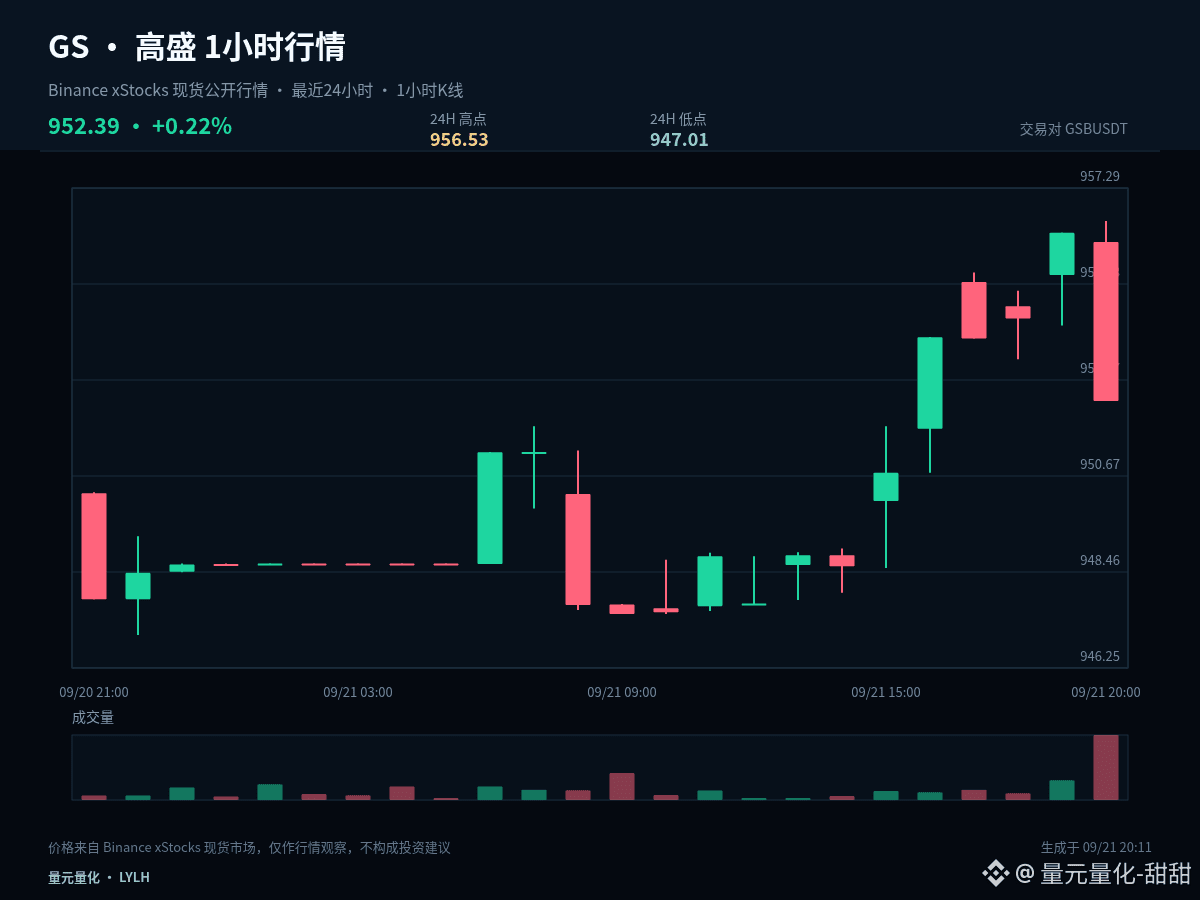
$GSB #GS This time, I’ll break it down from a position-based perspective. The same chart highlights different focal points for existing positions versus being in cash. Current price: 952.39; 1 hour: -0.40%, 24 hours: +0.24%.
Right now, 1 hour is -0.40% and 24 hours is +0.24%. These two timeframes haven’t formed a sufficiently clear alignment in the same direction. In a range-bound market, tolerance for chasing or killing the move is lower. It’s more suitable to confirm direction with the upper boundary, confirm follow-through with the lower boundary, while the midline is only used as the strength/weakness dividing line.
For existing positions, watch whether 947.01 breaks down. If it is breached, first reduce risk exposure. For those in cash, wait for the low to stop making lower lows, and confirm that price has returned above 951.77—don’t try to catch the falling structure early.
My scenario planning is not a single-direction bet. If price breaks above 956.53 and can hold, it means the upside room has been reopened. If it breaks below 947.01 and cannot reclaim on the retest, it indicates the structure has weakened further. If it trades between these levels, keep observing the closing behavior on both sides of 951.77.
Existing positions can be handled in stages based on key levels to avoid making the entire decision at once. Those without a position should wait for confirmation of a breakout or for a pullback to stabilize. For US stock instruments, also be mindful of volatility caused by session changes. Your plan should be based on price conditions—don’t let emotions replace execution.
A trading plan must include invalidation conditions. If your judgment is correct, you can realize it in segments. If your judgment is wrong, you must allow yourself to exit—don’t use adding to positions to mask that the original logic has already changed. The market will update, and your views should adjust along with the price evidence.
#SouthAfricaProposesCryptoExchangeControls
Right now, 1 hour is -0.40% and 24 hours is +0.24%. These two timeframes haven’t formed a sufficiently clear alignment in the same direction. In a range-bound market, tolerance for chasing or killing the move is lower. It’s more suitable to confirm direction with the upper boundary, confirm follow-through with the lower boundary, while the midline is only used as the strength/weakness dividing line.
For existing positions, watch whether 947.01 breaks down. If it is breached, first reduce risk exposure. For those in cash, wait for the low to stop making lower lows, and confirm that price has returned above 951.77—don’t try to catch the falling structure early.
My scenario planning is not a single-direction bet. If price breaks above 956.53 and can hold, it means the upside room has been reopened. If it breaks below 947.01 and cannot reclaim on the retest, it indicates the structure has weakened further. If it trades between these levels, keep observing the closing behavior on both sides of 951.77.
Existing positions can be handled in stages based on key levels to avoid making the entire decision at once. Those without a position should wait for confirmation of a breakout or for a pullback to stabilize. For US stock instruments, also be mindful of volatility caused by session changes. Your plan should be based on price conditions—don’t let emotions replace execution.
A trading plan must include invalidation conditions. If your judgment is correct, you can realize it in segments. If your judgment is wrong, you must allow yourself to exit—don’t use adding to positions to mask that the original logic has already changed. The market will update, and your views should adjust along with the price evidence.
#SouthAfricaProposesCryptoExchangeControls