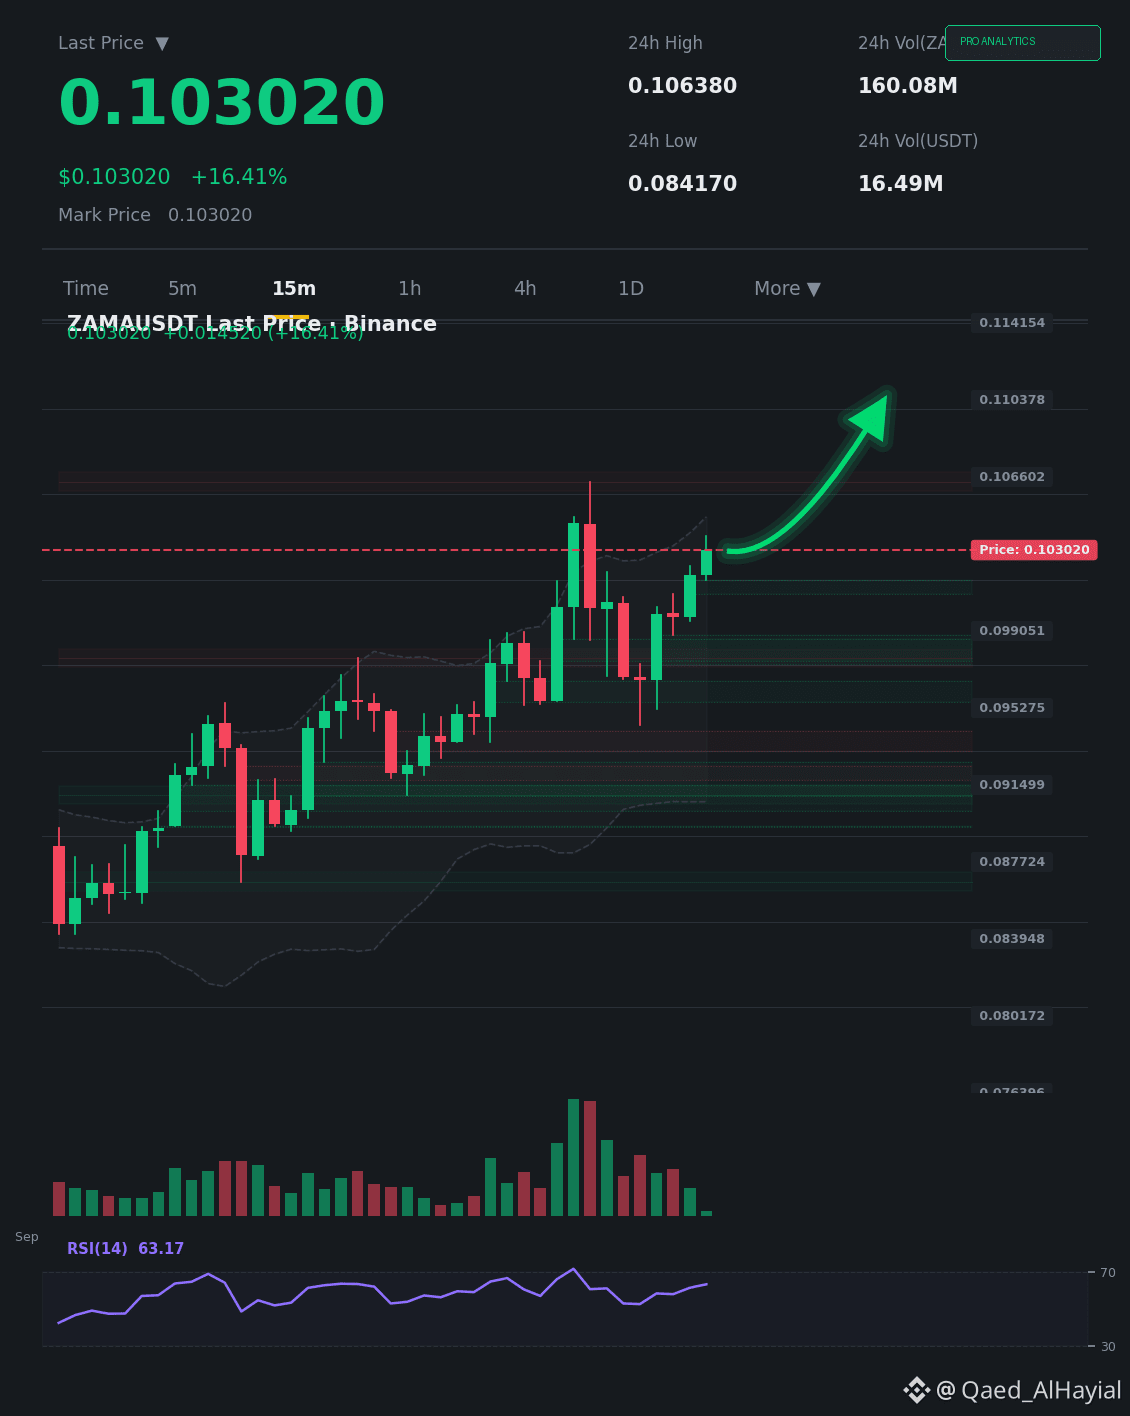
$ZAMA It rises 18.8% within 24 hours... but where does it go from here? 📈
The move on the 15-minute chart is strongly directional, but the trading volume is relatively low (ratio 0.14), which makes liquidity thin. This means the breakout may lack follow-through, and we may see a slight pullback to test support zones.
The most likely scenario: a shallow correction toward 0.1000-0.1010 before continuing the upward move. The key support is at 0.0980, and a break above 0.1050 will open the door to higher targets.
Watch the RSI indicator on the 15-minute timeframe to confirm consolidation.
Follow us for the next detailed analysis 🎯
$ZAMA
This content is not investment advice—do your own research (DYOR)
The move on the 15-minute chart is strongly directional, but the trading volume is relatively low (ratio 0.14), which makes liquidity thin. This means the breakout may lack follow-through, and we may see a slight pullback to test support zones.
The most likely scenario: a shallow correction toward 0.1000-0.1010 before continuing the upward move. The key support is at 0.0980, and a break above 0.1050 will open the door to higher targets.
Watch the RSI indicator on the 15-minute timeframe to confirm consolidation.
Follow us for the next detailed analysis 🎯
$ZAMA
This content is not investment advice—do your own research (DYOR)