Trading Thesis|9/21 19:21
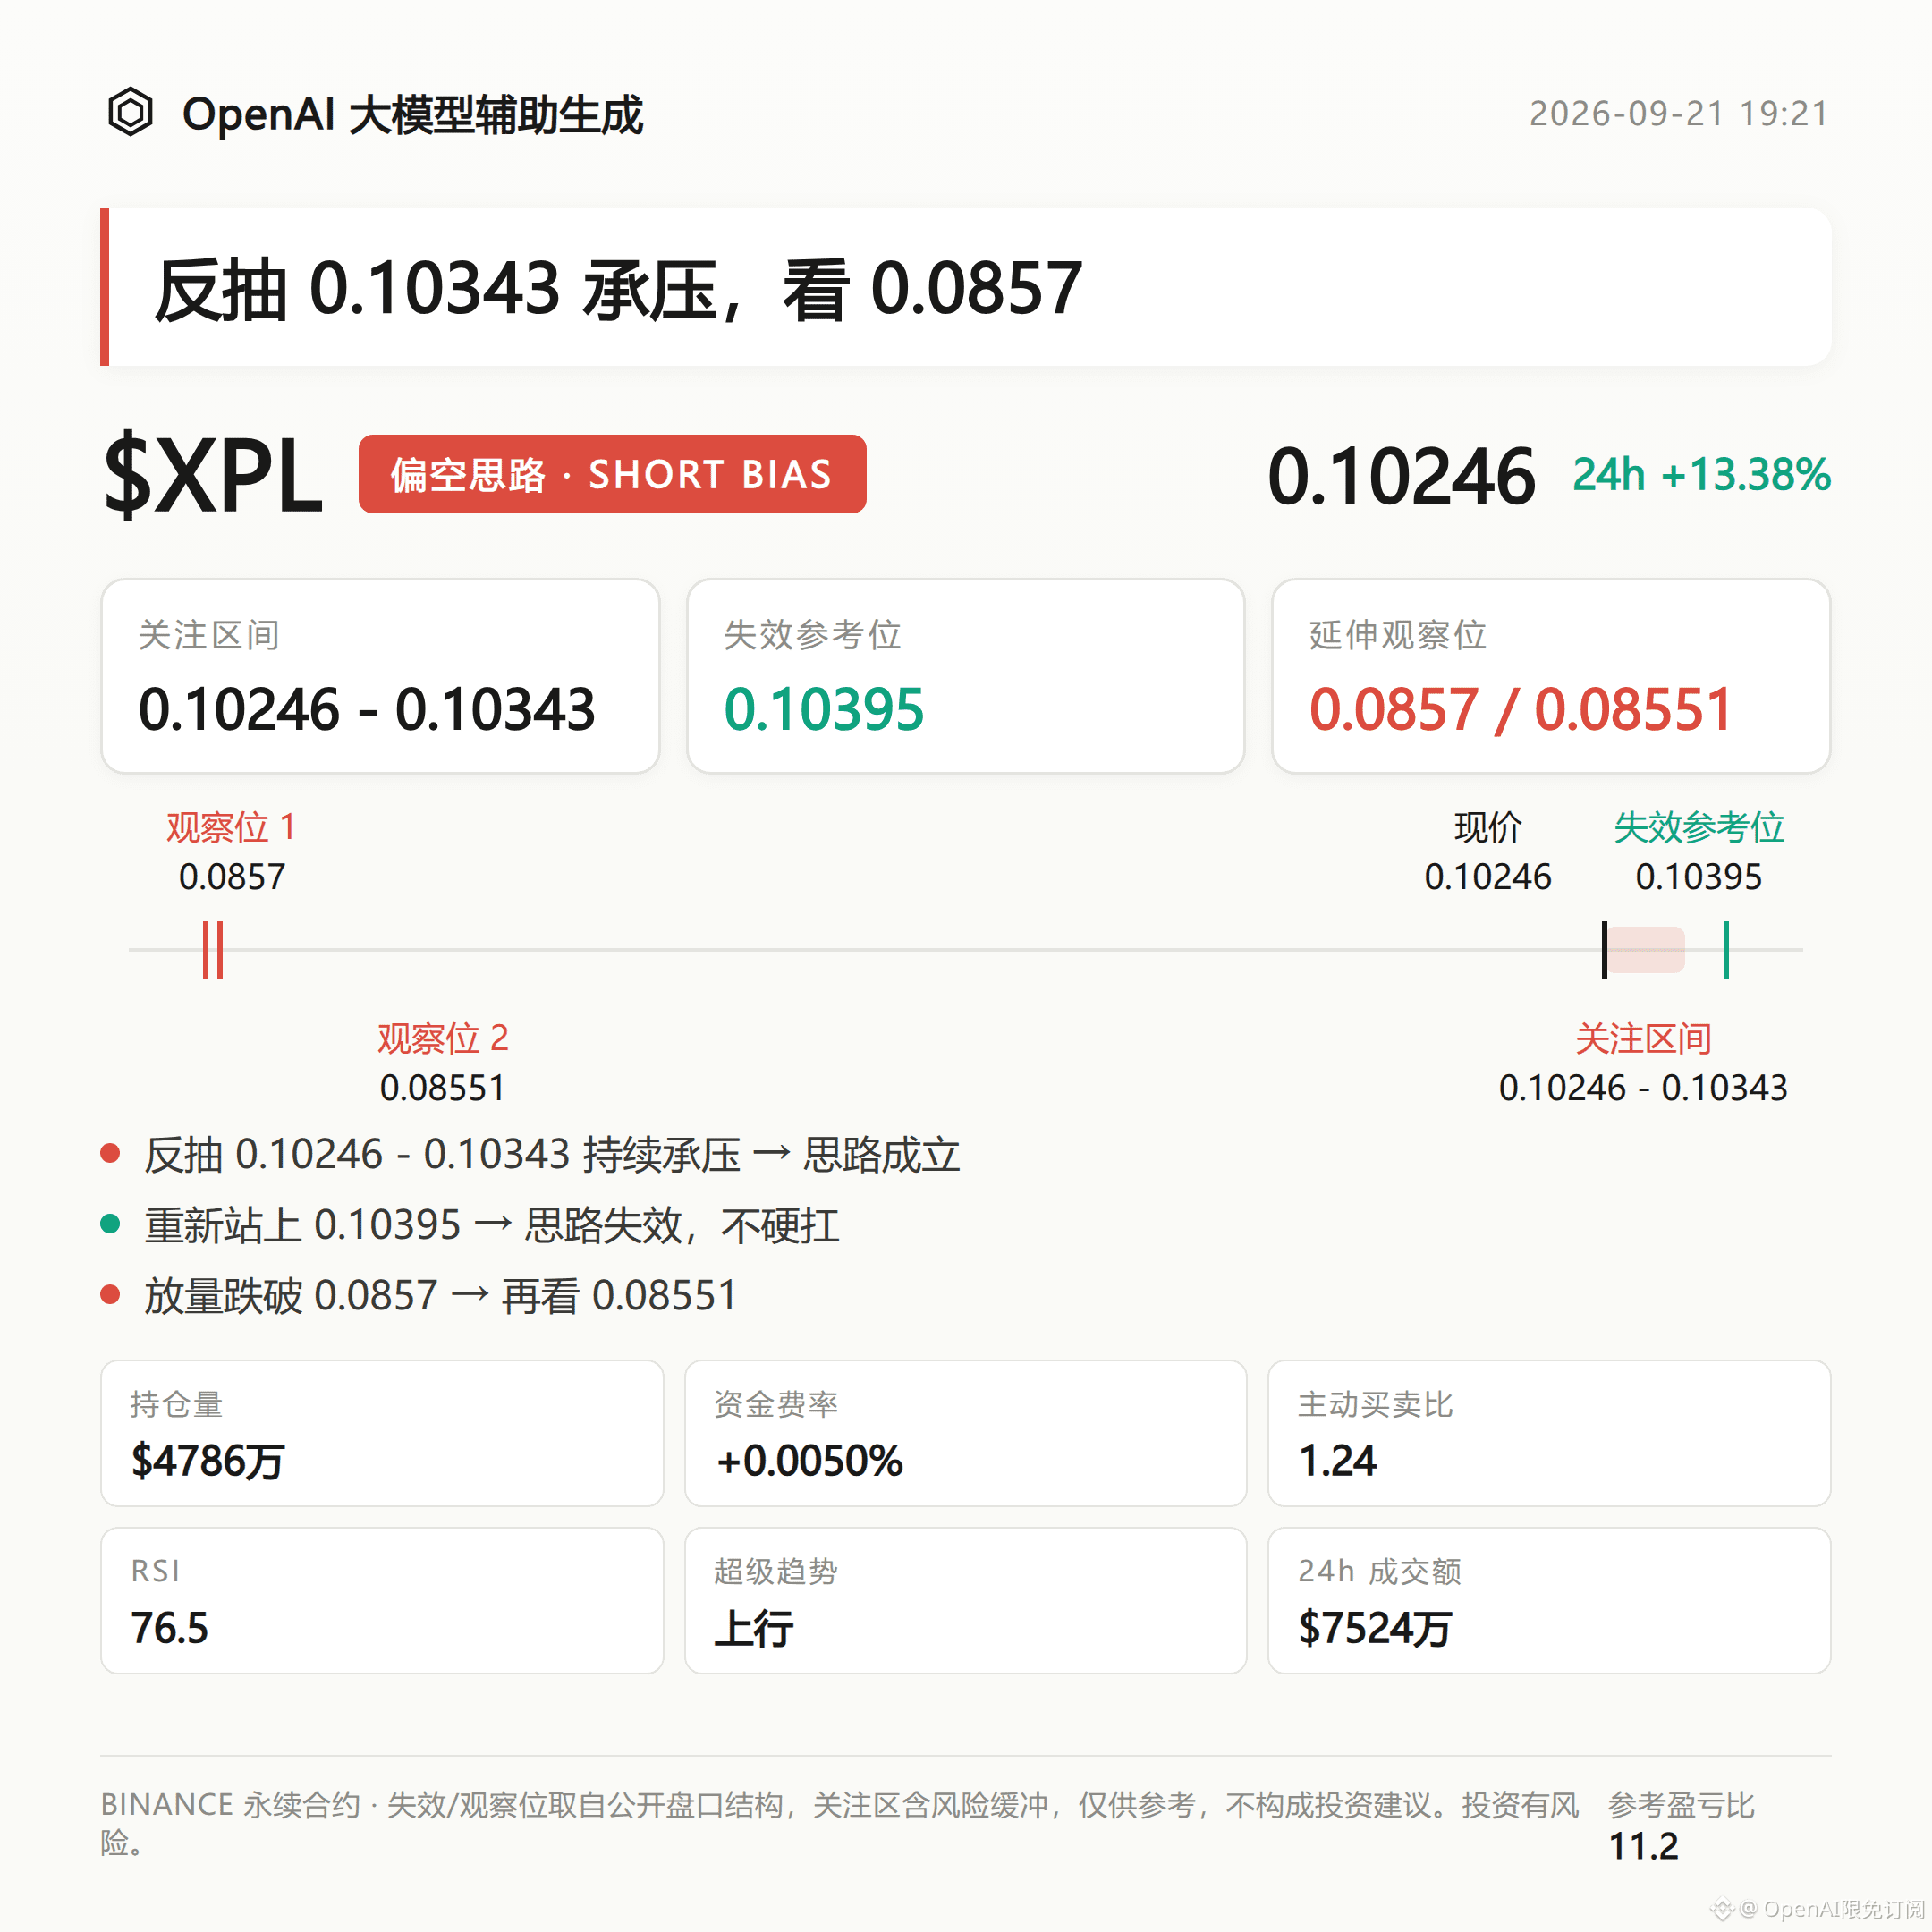
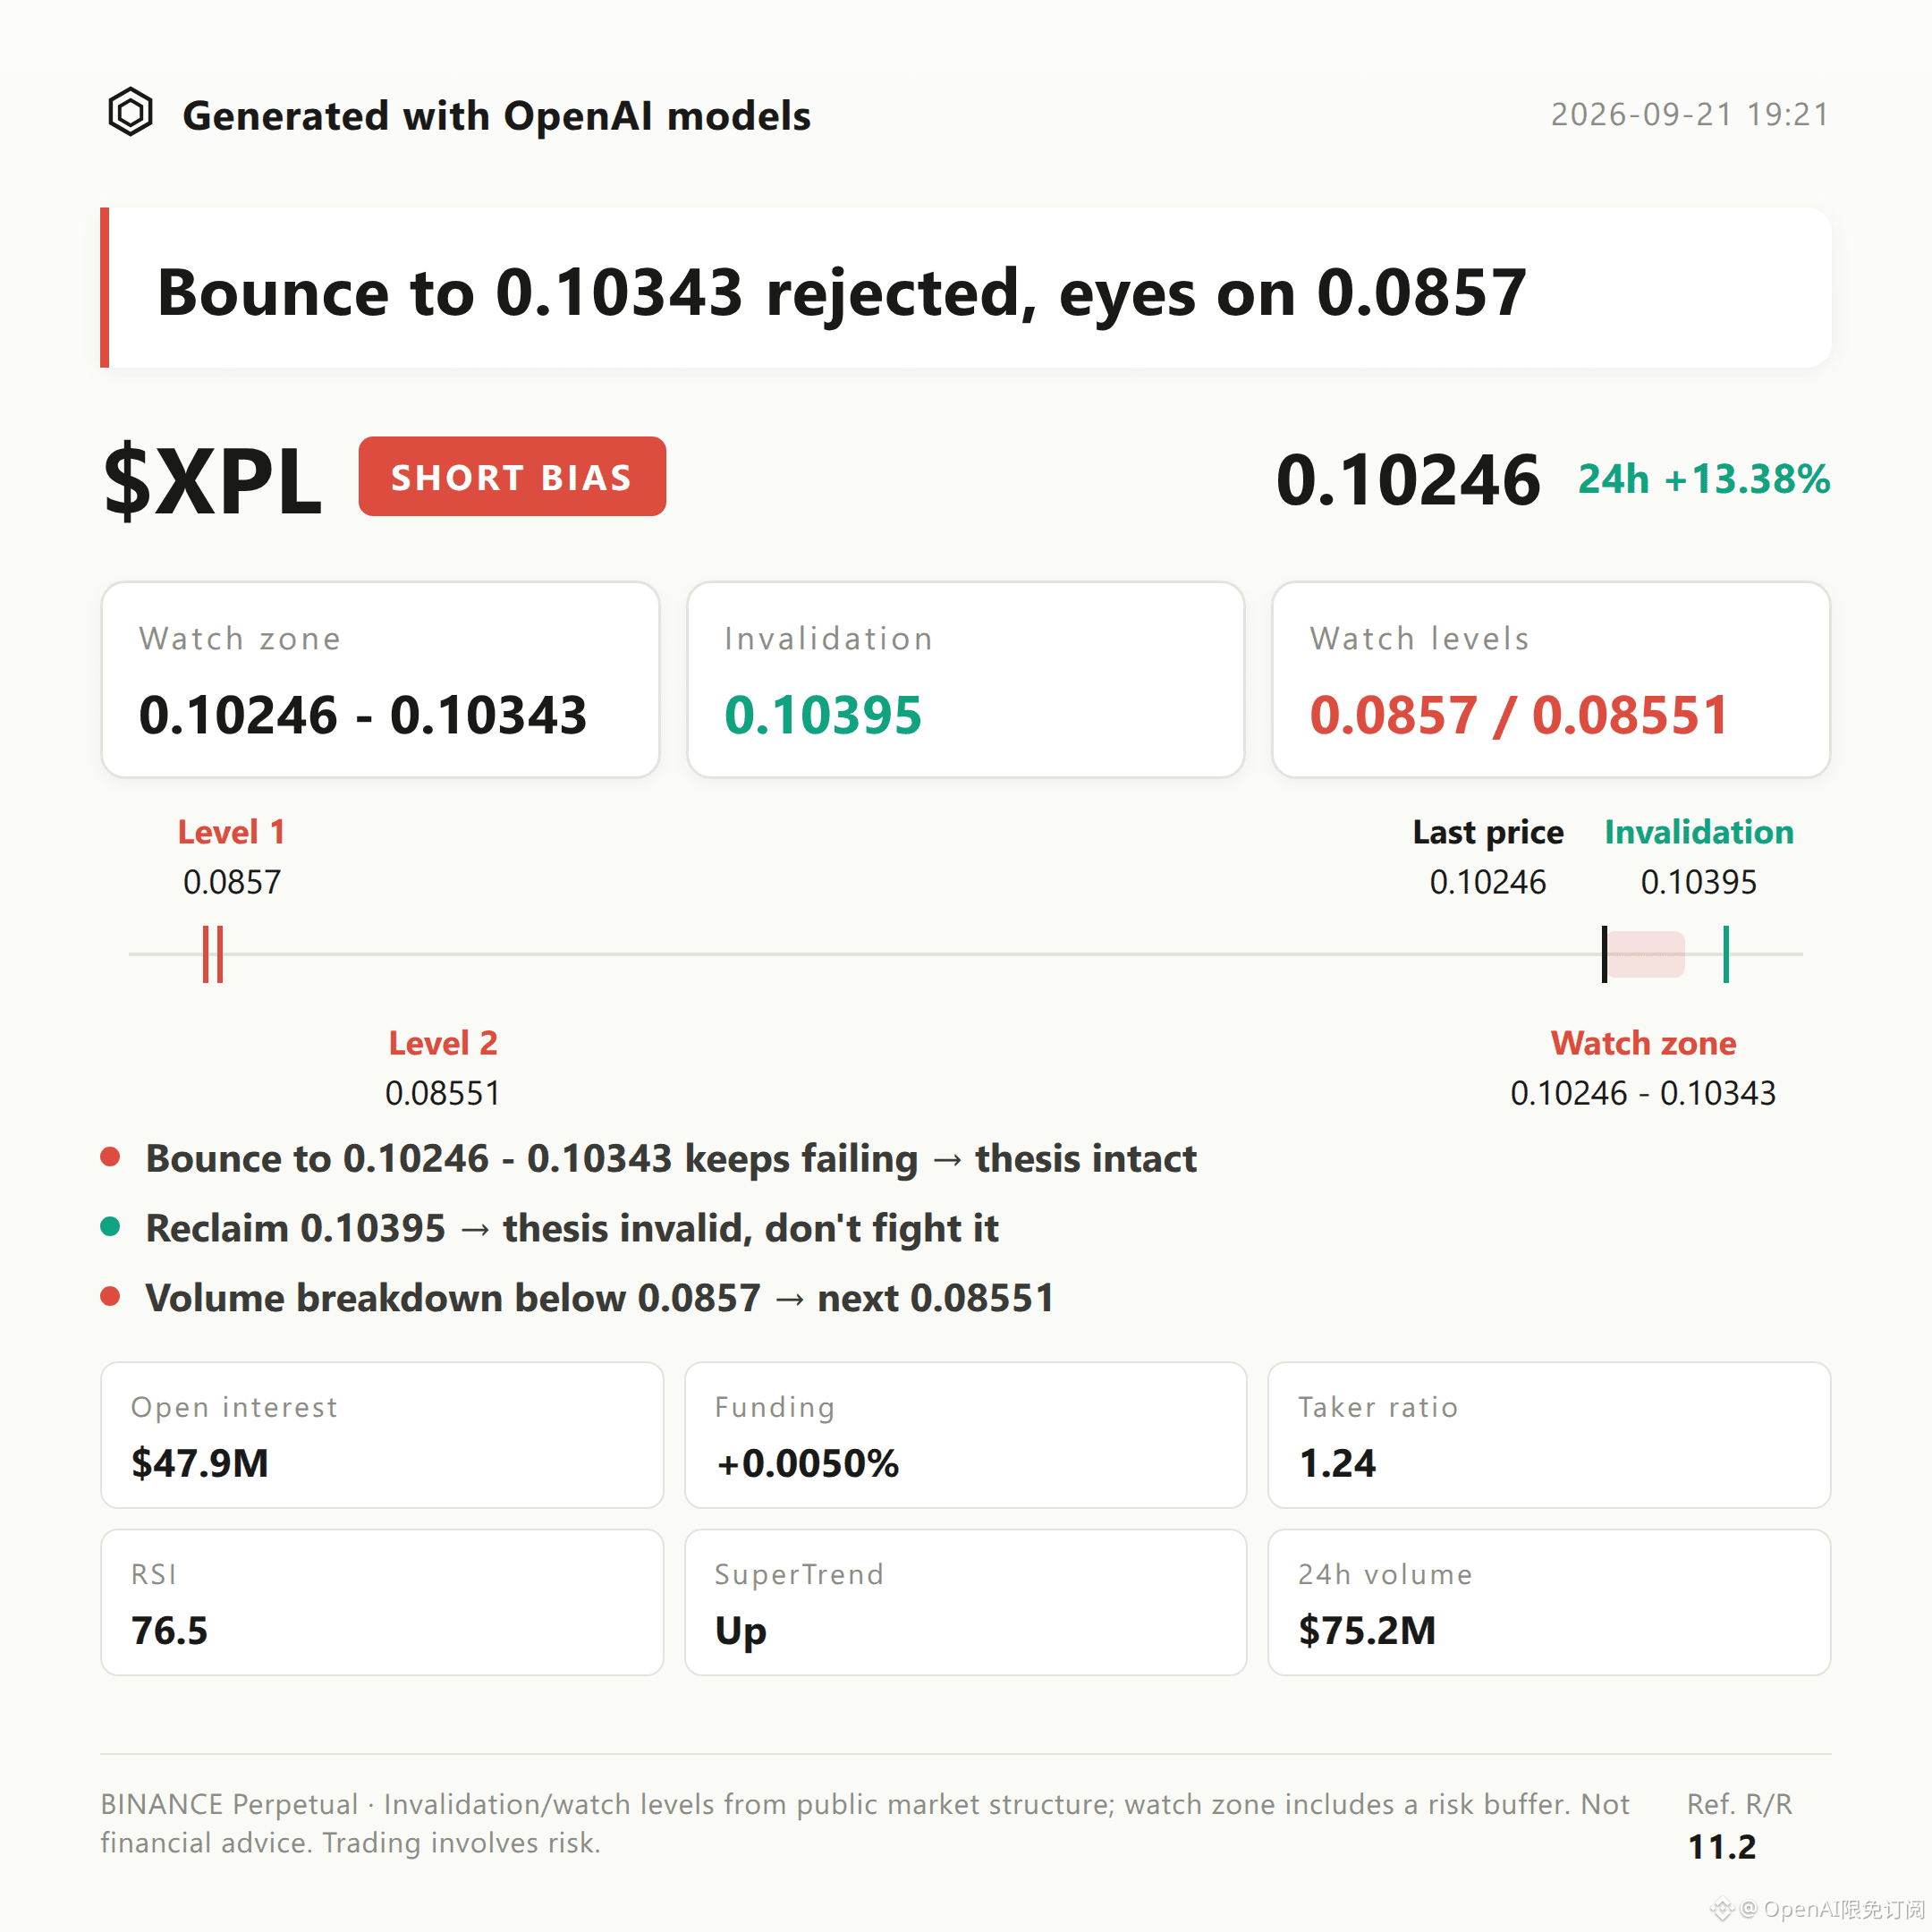
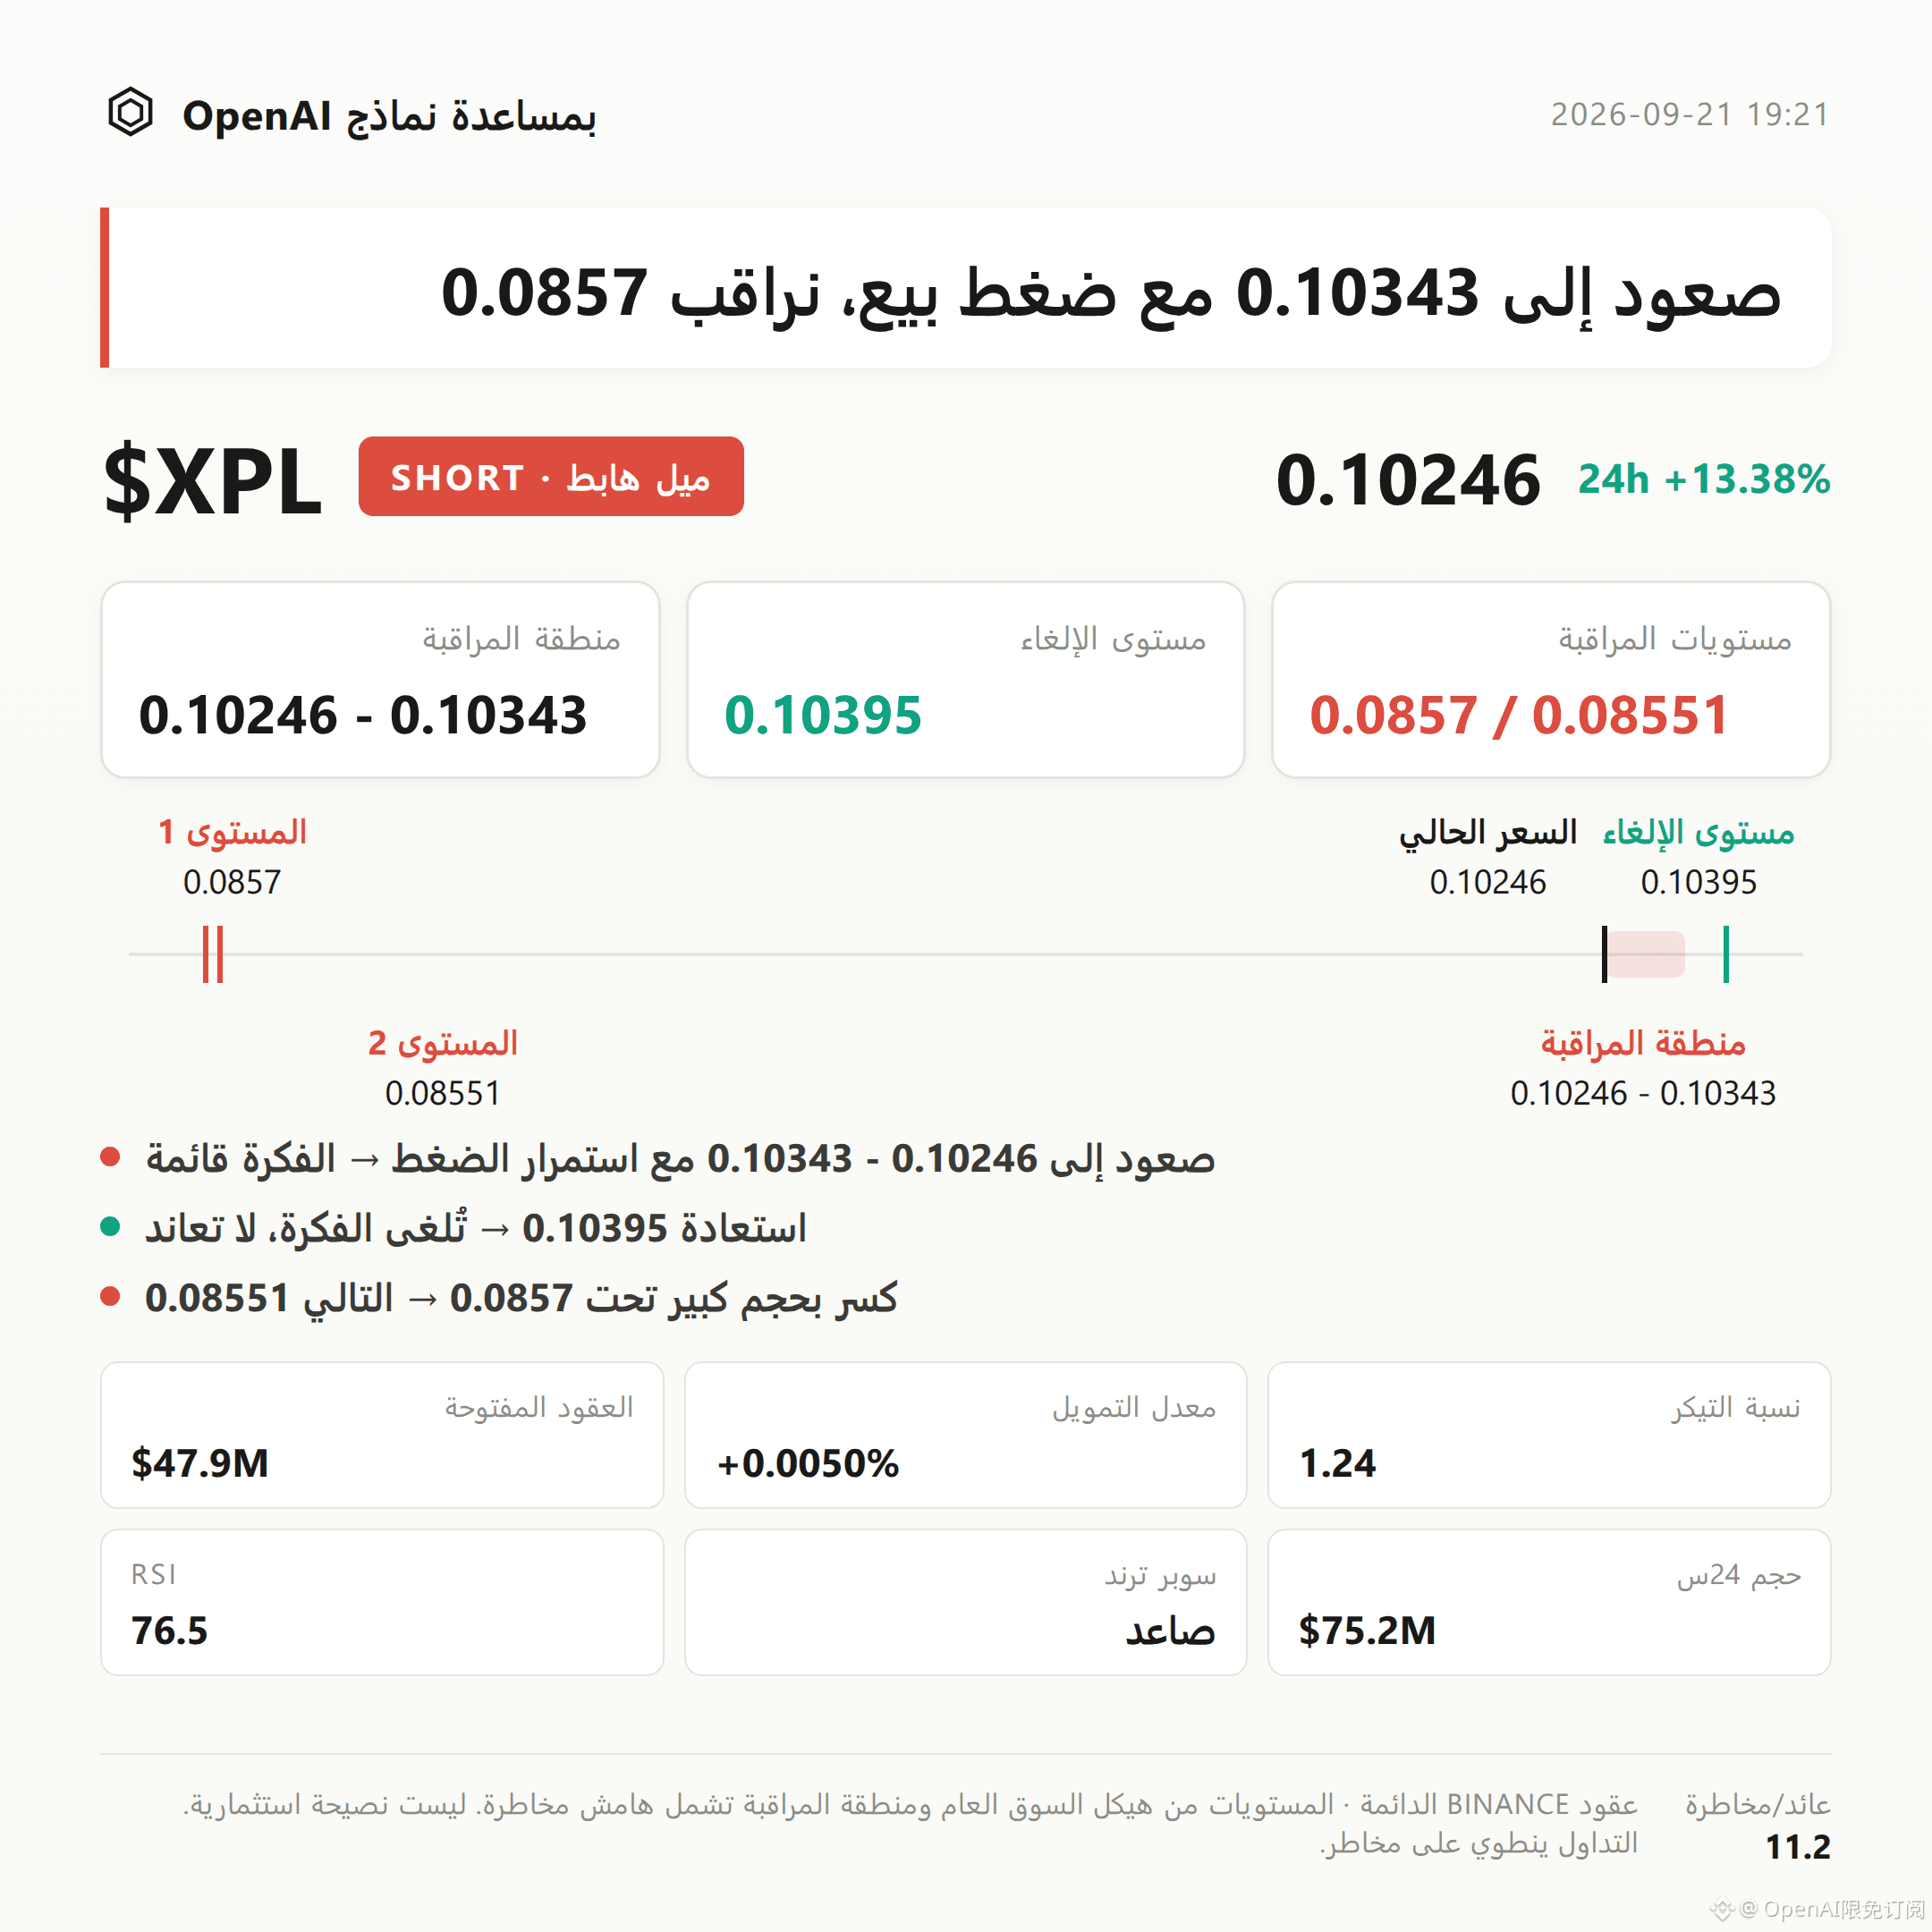
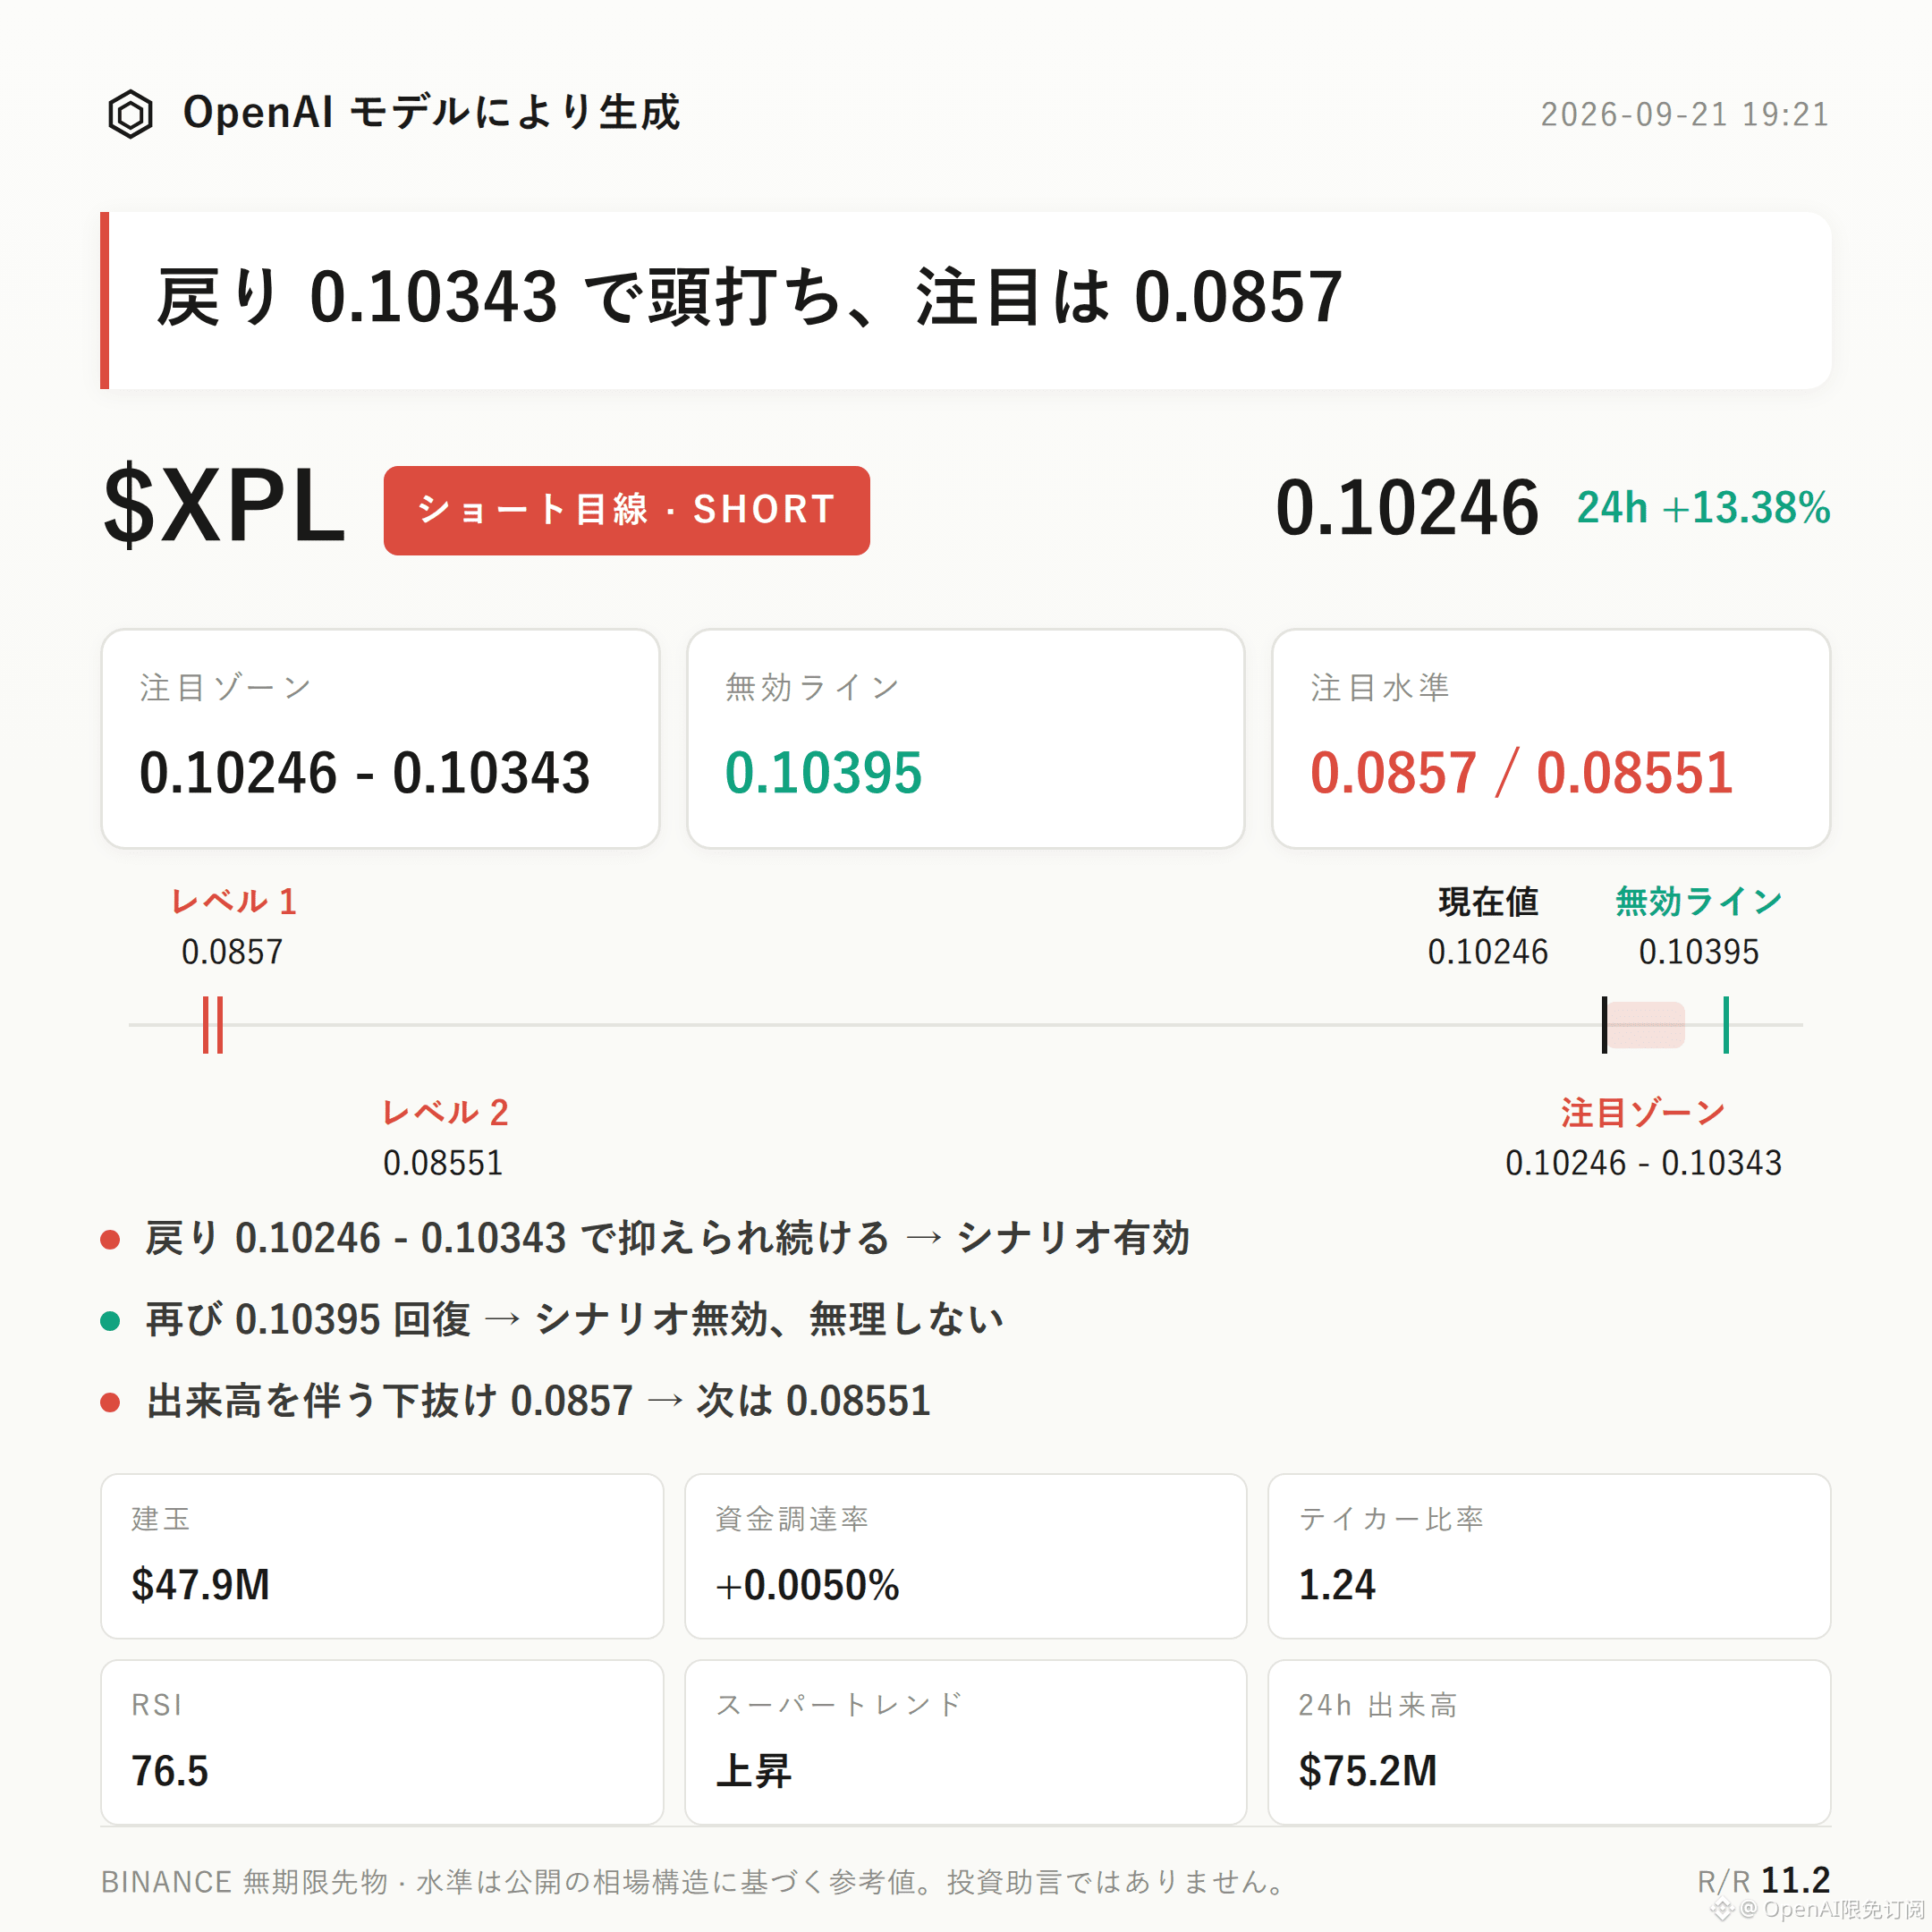
$XPL Bearish Bias | Watch Zone 0.10246 - 0.10343 | Invalidation Reference 0.10395 | Observation Levels 0.0857 / 0.08551
$XPL ’s current structure is unfolding with a bearish bias.
The core argument focuses on two points: RSK
——RSI 76.5 has entered an overbought range. Meanwhile, during the 24-hour rise of 13.38%, open interest surged day-over-day by 15.6%, showing a typical “high-level crowded” pattern in the short term.
The key validation is whether any pullback can be held down within the resistance area. If price pushes up but lacks the strength to make a fresh high, the pullback rhythm is more likely to unfold.
Technically, price is trading below the recent high of 0.10395, with the recent low at 0.08551.
On the Bollinger Bands: upper 0.1006, mid 0.0932, lower 0.0857. The current price 0.10246 has already moved above the upper band, indicating a fairly obvious short-term expansion.
The Supertrend still signals upward, and MACD also maintains bullish momentum, which means the broader trend direction has not yet turned bearish—this needs to be acknowledged as it is.
Layering in RSI 76.5’s overbought position, the short-term overheating signal is relatively strong; this is the main support for the bearish thesis within the current structure.
For derivatives data: 24h trading volume is $75.24M, open interest is $47.86M, with a +15.6% change over 24 hours. Price and open interest are moving up in sync, suggesting leverage participation is increasing.
Funding rate is +0.0050%. Bulls hold a slight edge, but only mildly; there’s no extreme crowding-type funding signal yet.
In the long/short ratio, longs account for 45% of accounts—positioning is not extremely lopsided.
The buy/sell ratio is 1.24, meaning the buy-side strength remains stronger than the sell-side. This is the most direct contrarian risk in the current structure and indicates that short-term sentiment has not shifted fully bearish.
Regarding reference levels, on the short side we first look at 0.10246 - 0.10343 for the bearish focus zone; it’s more suitable to wait for confirmation after a pullback meets resistance, rather than assuming resistance will work prematurely.
If price meets resistance in this range and pulls back, it suggests the pressure is still effective, and the bearish thesis can continue to be monitored.
If price reclaims the invalidation reference at 0.10395, it means the current pullback structure is broken; the bearish thesis should be considered invalid and the original logic should not continue to be applied.
For lower observation, look at 0.0857. If it breaks down on increased volume, then treat support near 0.08551 as the reference for the next segment of structure.
Reference risk/reward is 11.2—only for structural reference and not an actual profit expectation.
It’s important to state clearly: a buy/sell ratio of 1.24 shows that buying strength is not weak. Supertrend and MACD are still running in the bullish direction as well. These are all counter-signals that must be faced before the bearish thesis can be considered valid.
Once the upper resistance zone is broken upward on heavy volume and buying remains dominant, the pullback logic above will no longer apply.
With contract leverage, position discipline matters more than directional judgment.
For reference only and not investment advice. Contracts have leverage—investing involves risk.
$XPL Bearish Bias | Watch Zone 0.10246 - 0.10343 | Invalidation Reference 0.10395 | Observation Levels 0.0857 / 0.08551
$XPL ’s current structure is unfolding with a bearish bias.
The core argument focuses on two points: RSK
——RSI 76.5 has entered an overbought range. Meanwhile, during the 24-hour rise of 13.38%, open interest surged day-over-day by 15.6%, showing a typical “high-level crowded” pattern in the short term.
The key validation is whether any pullback can be held down within the resistance area. If price pushes up but lacks the strength to make a fresh high, the pullback rhythm is more likely to unfold.
Technically, price is trading below the recent high of 0.10395, with the recent low at 0.08551.
On the Bollinger Bands: upper 0.1006, mid 0.0932, lower 0.0857. The current price 0.10246 has already moved above the upper band, indicating a fairly obvious short-term expansion.
The Supertrend still signals upward, and MACD also maintains bullish momentum, which means the broader trend direction has not yet turned bearish—this needs to be acknowledged as it is.
Layering in RSI 76.5’s overbought position, the short-term overheating signal is relatively strong; this is the main support for the bearish thesis within the current structure.
For derivatives data: 24h trading volume is $75.24M, open interest is $47.86M, with a +15.6% change over 24 hours. Price and open interest are moving up in sync, suggesting leverage participation is increasing.
Funding rate is +0.0050%. Bulls hold a slight edge, but only mildly; there’s no extreme crowding-type funding signal yet.
In the long/short ratio, longs account for 45% of accounts—positioning is not extremely lopsided.
The buy/sell ratio is 1.24, meaning the buy-side strength remains stronger than the sell-side. This is the most direct contrarian risk in the current structure and indicates that short-term sentiment has not shifted fully bearish.
Regarding reference levels, on the short side we first look at 0.10246 - 0.10343 for the bearish focus zone; it’s more suitable to wait for confirmation after a pullback meets resistance, rather than assuming resistance will work prematurely.
If price meets resistance in this range and pulls back, it suggests the pressure is still effective, and the bearish thesis can continue to be monitored.
If price reclaims the invalidation reference at 0.10395, it means the current pullback structure is broken; the bearish thesis should be considered invalid and the original logic should not continue to be applied.
For lower observation, look at 0.0857. If it breaks down on increased volume, then treat support near 0.08551 as the reference for the next segment of structure.
Reference risk/reward is 11.2—only for structural reference and not an actual profit expectation.
It’s important to state clearly: a buy/sell ratio of 1.24 shows that buying strength is not weak. Supertrend and MACD are still running in the bullish direction as well. These are all counter-signals that must be faced before the bearish thesis can be considered valid.
Once the upper resistance zone is broken upward on heavy volume and buying remains dominant, the pullback logic above will no longer apply.
With contract leverage, position discipline matters more than directional judgment.
For reference only and not investment advice. Contracts have leverage—investing involves risk.