

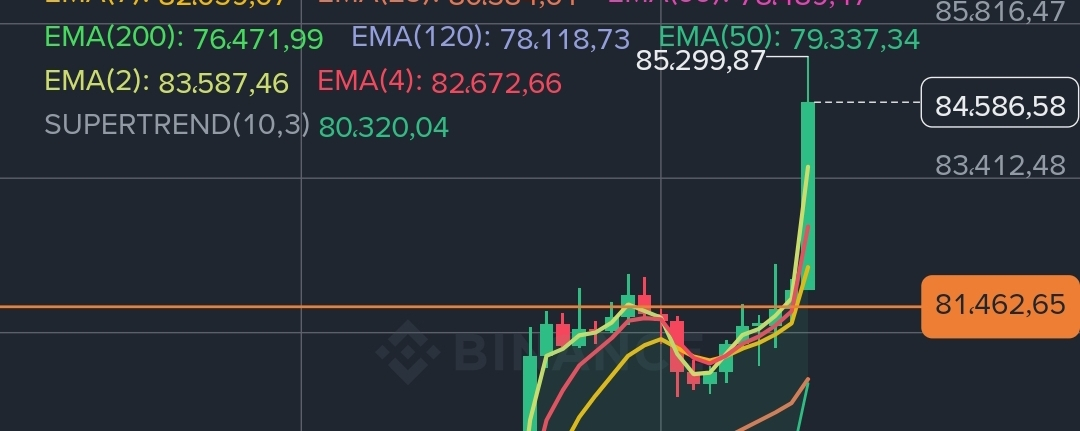


When we say that 81460 is the breakout and decision point for any upward extension… we’re not just throwing a number on the chart and waiting for luck. Price broke above it, then kept testing it for more than 26 days—each time it failed to maintain it. And when it returned and broke it again, we didn’t see an upward move; because the simple condition for the rise hadn’t been met. Then the scene changed. The first 4-hour candle appeared closing above 81460, and the candle that followed came to confirm control over that same point—then the price explosion happened. Here you should pause… because you’re not dealing with a number that hit by chance. You’re dealing with a point that has a condition, an exam, and a result. So when we say that the market cap must hold above 2.72T to continue the rise, and then you find that 2.72T became a support area the market preserved before the breakout—tested it for more than a day and didn’t break it—you’re facing the same method. And when we say that the dollar dominance must break the 6.743 zone, then notice how 6.743 turned into a resistance area that it tested for more than a day—and still couldn’t penetrate… the picture becomes clearer. We’re not giving you numbers just so you know where price is. We’re defining for you where the decision is, what its condition is, what failure means, and what success means. This is the difference between someone who reads the chart after price has already moved… and someone who reads the logic of movement before it’s completed. When levels, conditions, tests, and outcomes repeat across more than one engine, know that you’re not dealing with guesswork numbers. Not with an accident that happened once. Not with analysis built after the move. You’re dealing with a school—measured by what it said before the move… and then by what the market did afterward. This is not financial advice, but an educational reading of the market. God is Most High and Knows Best, and good luck to everyone.