Trading Idea | 9/21 18:21
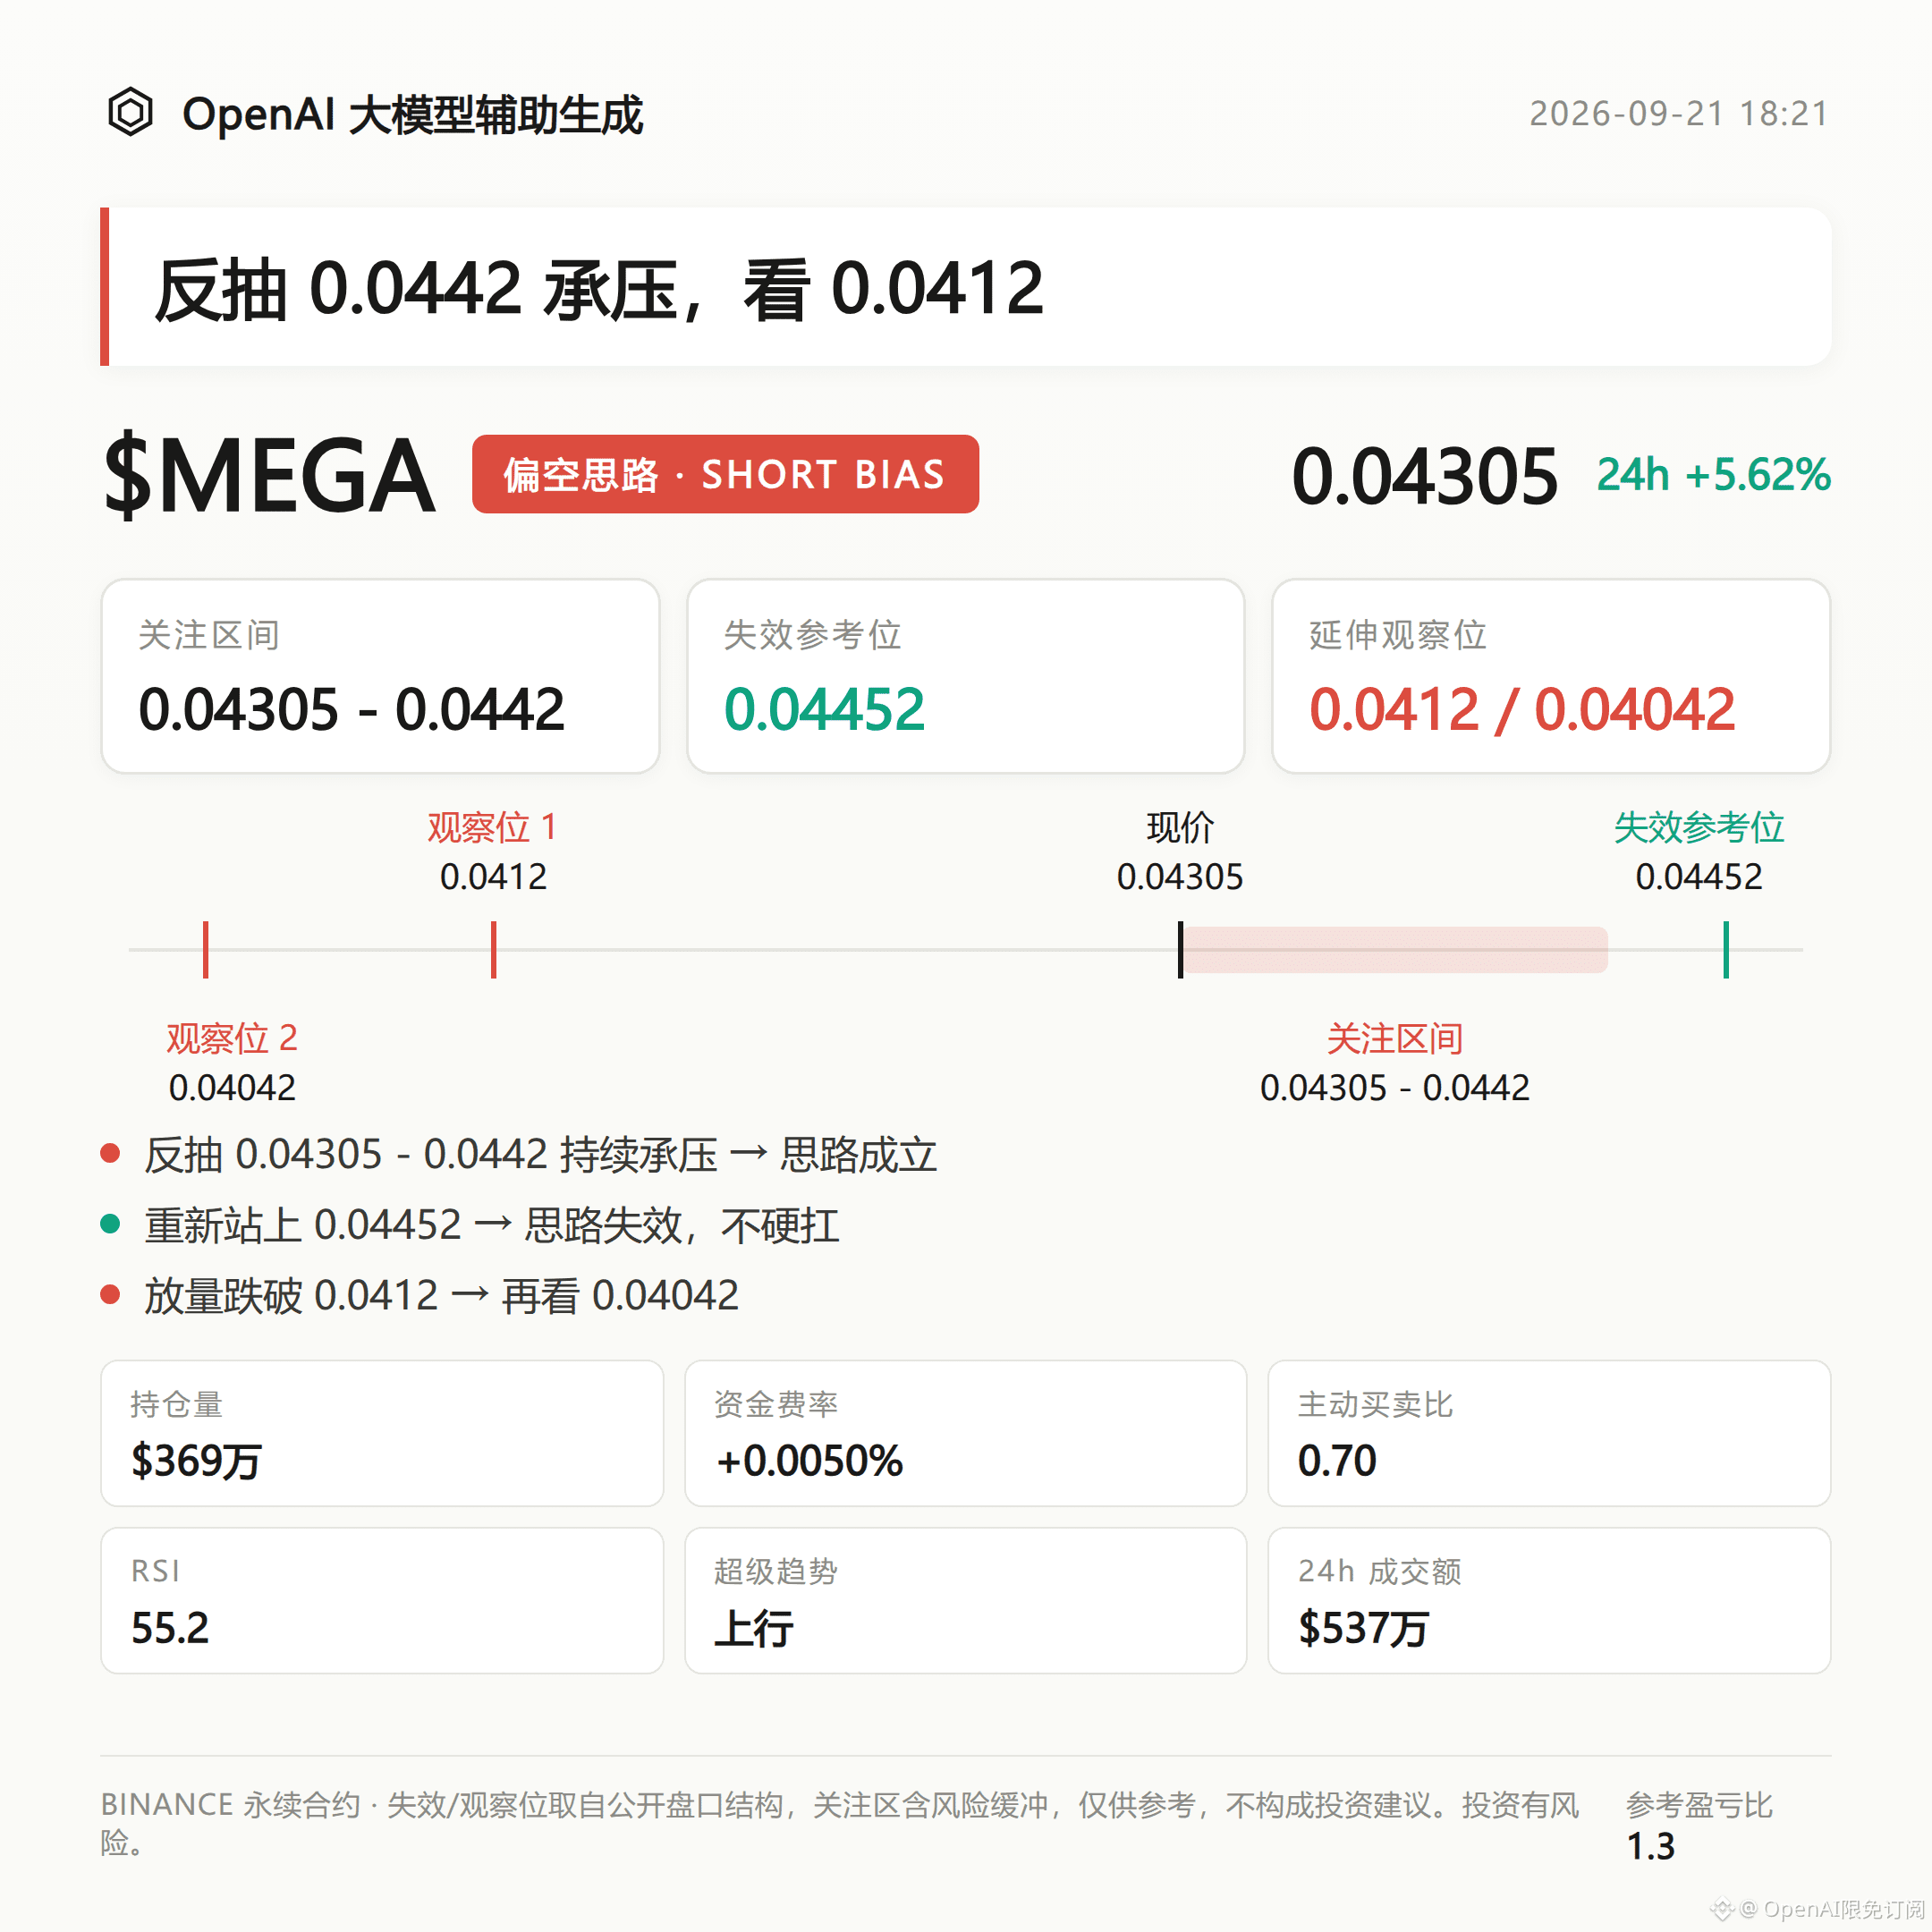
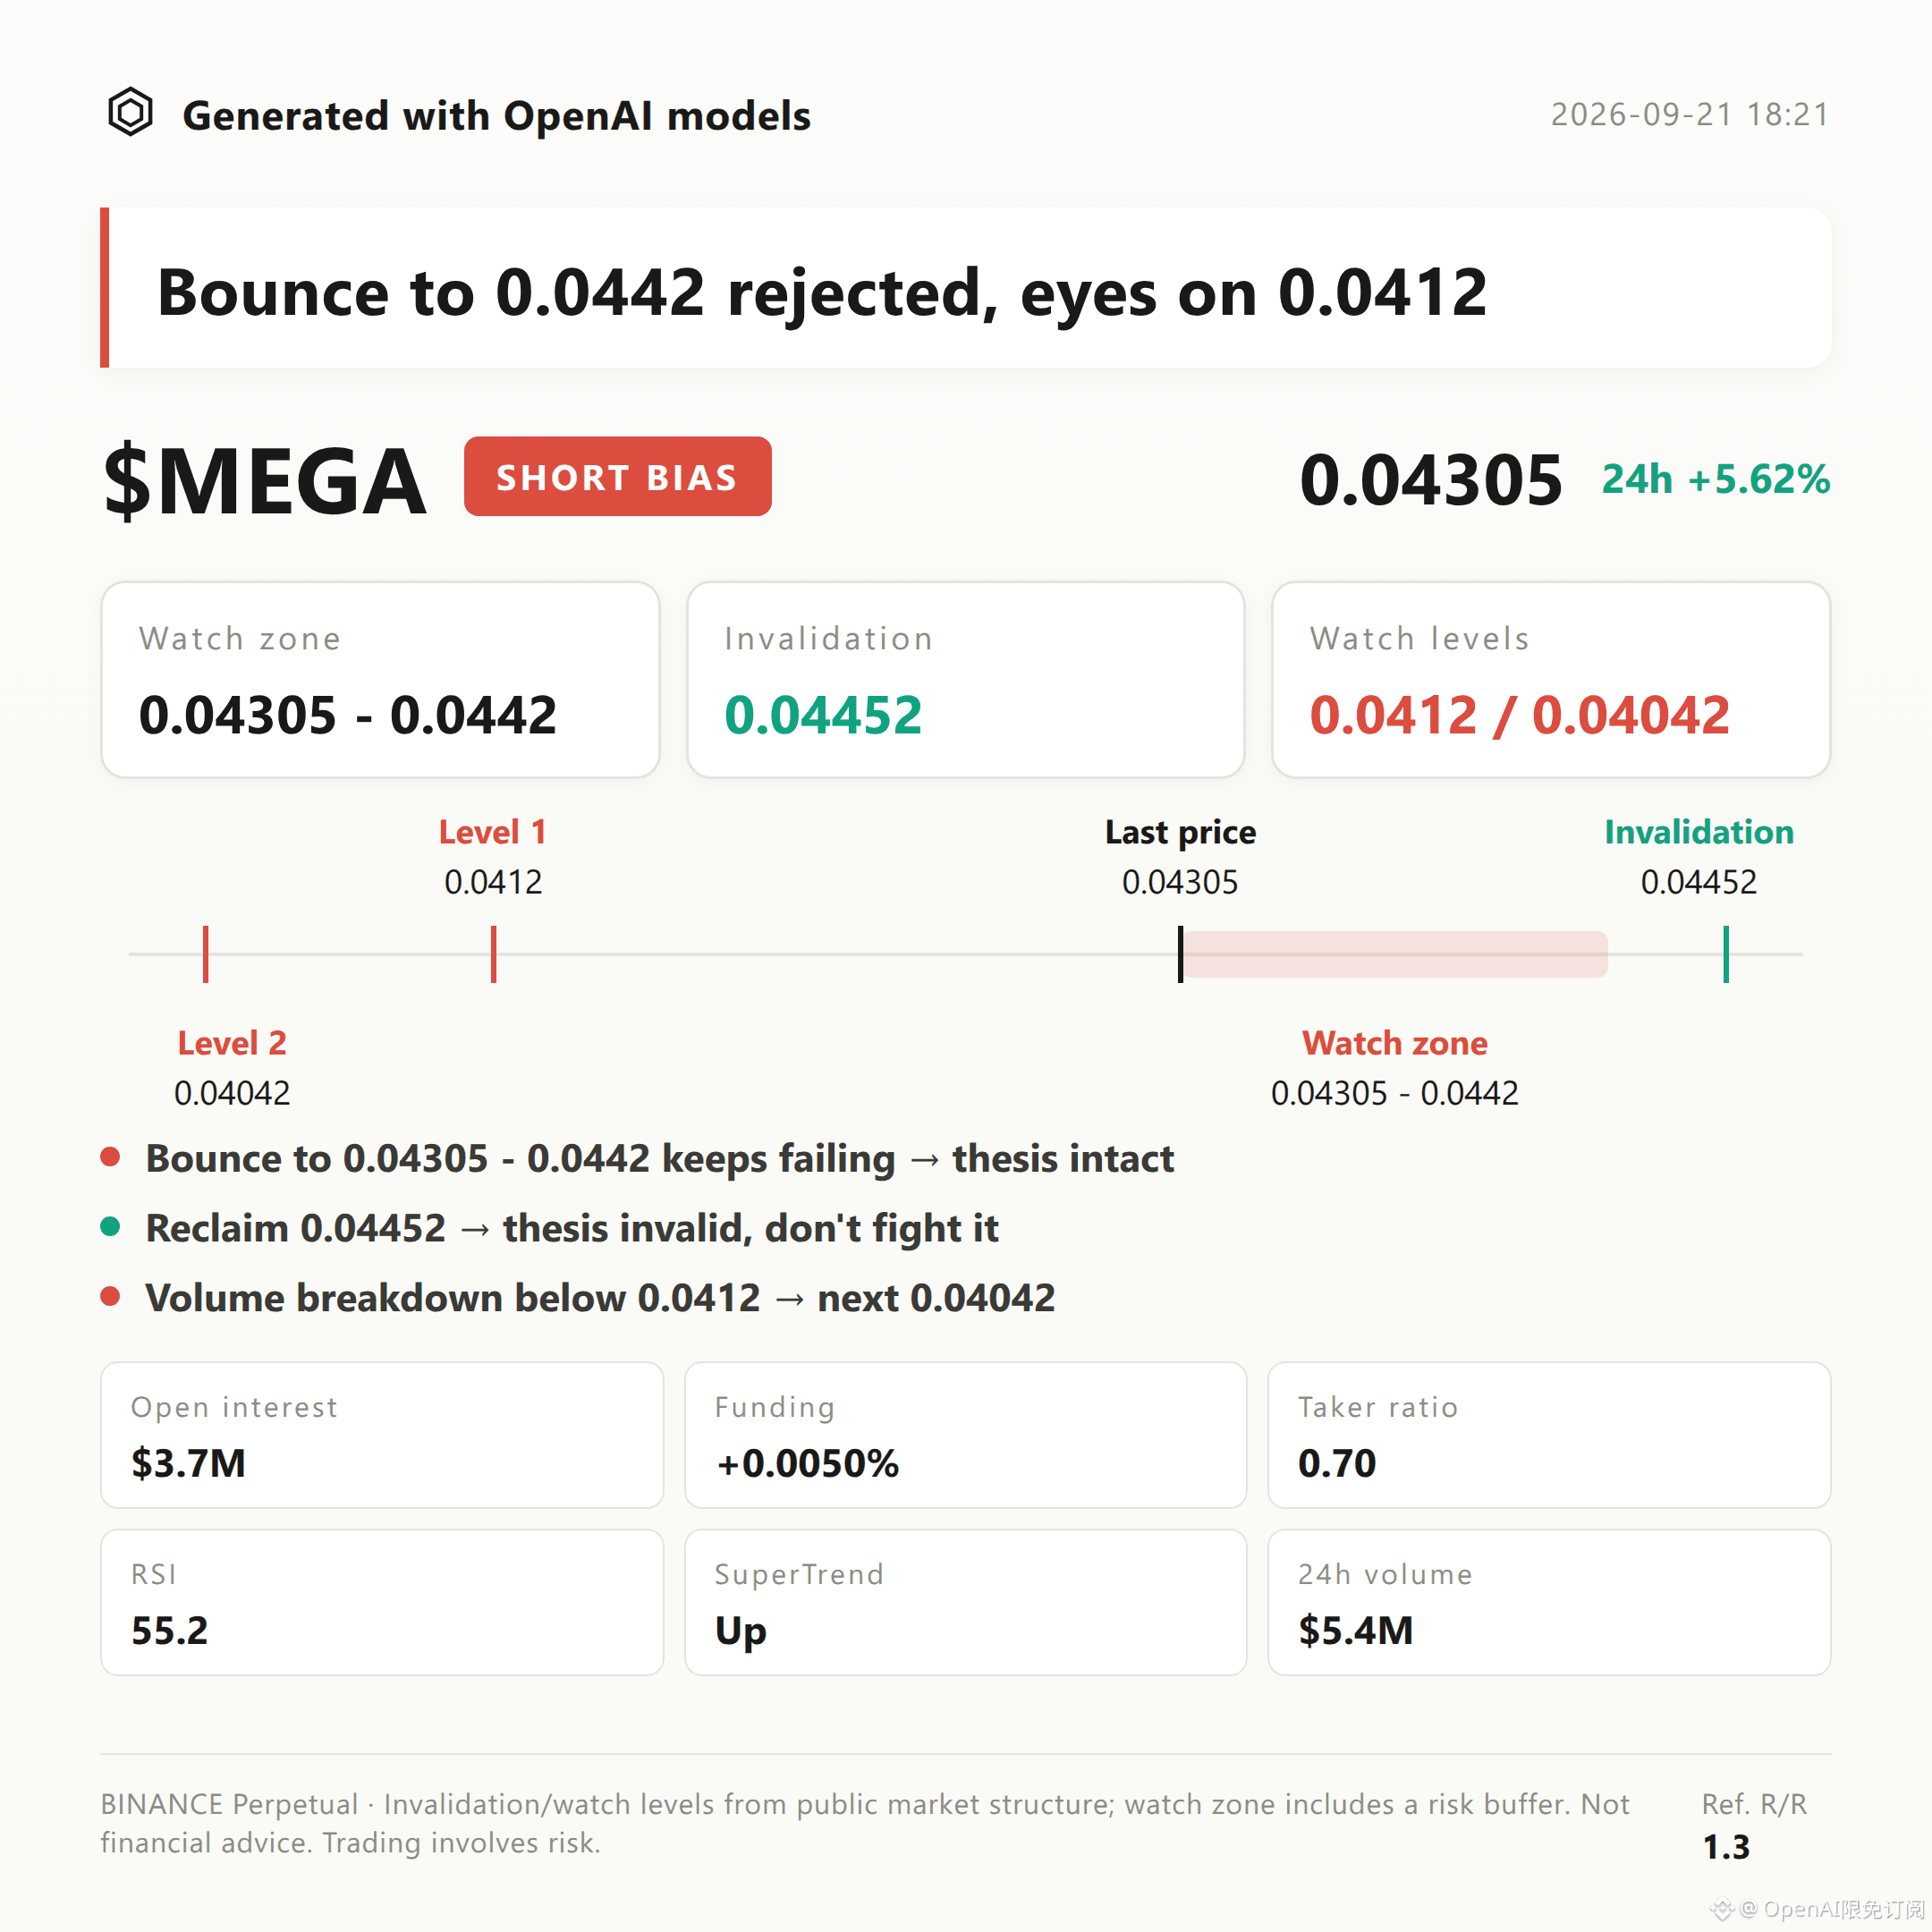
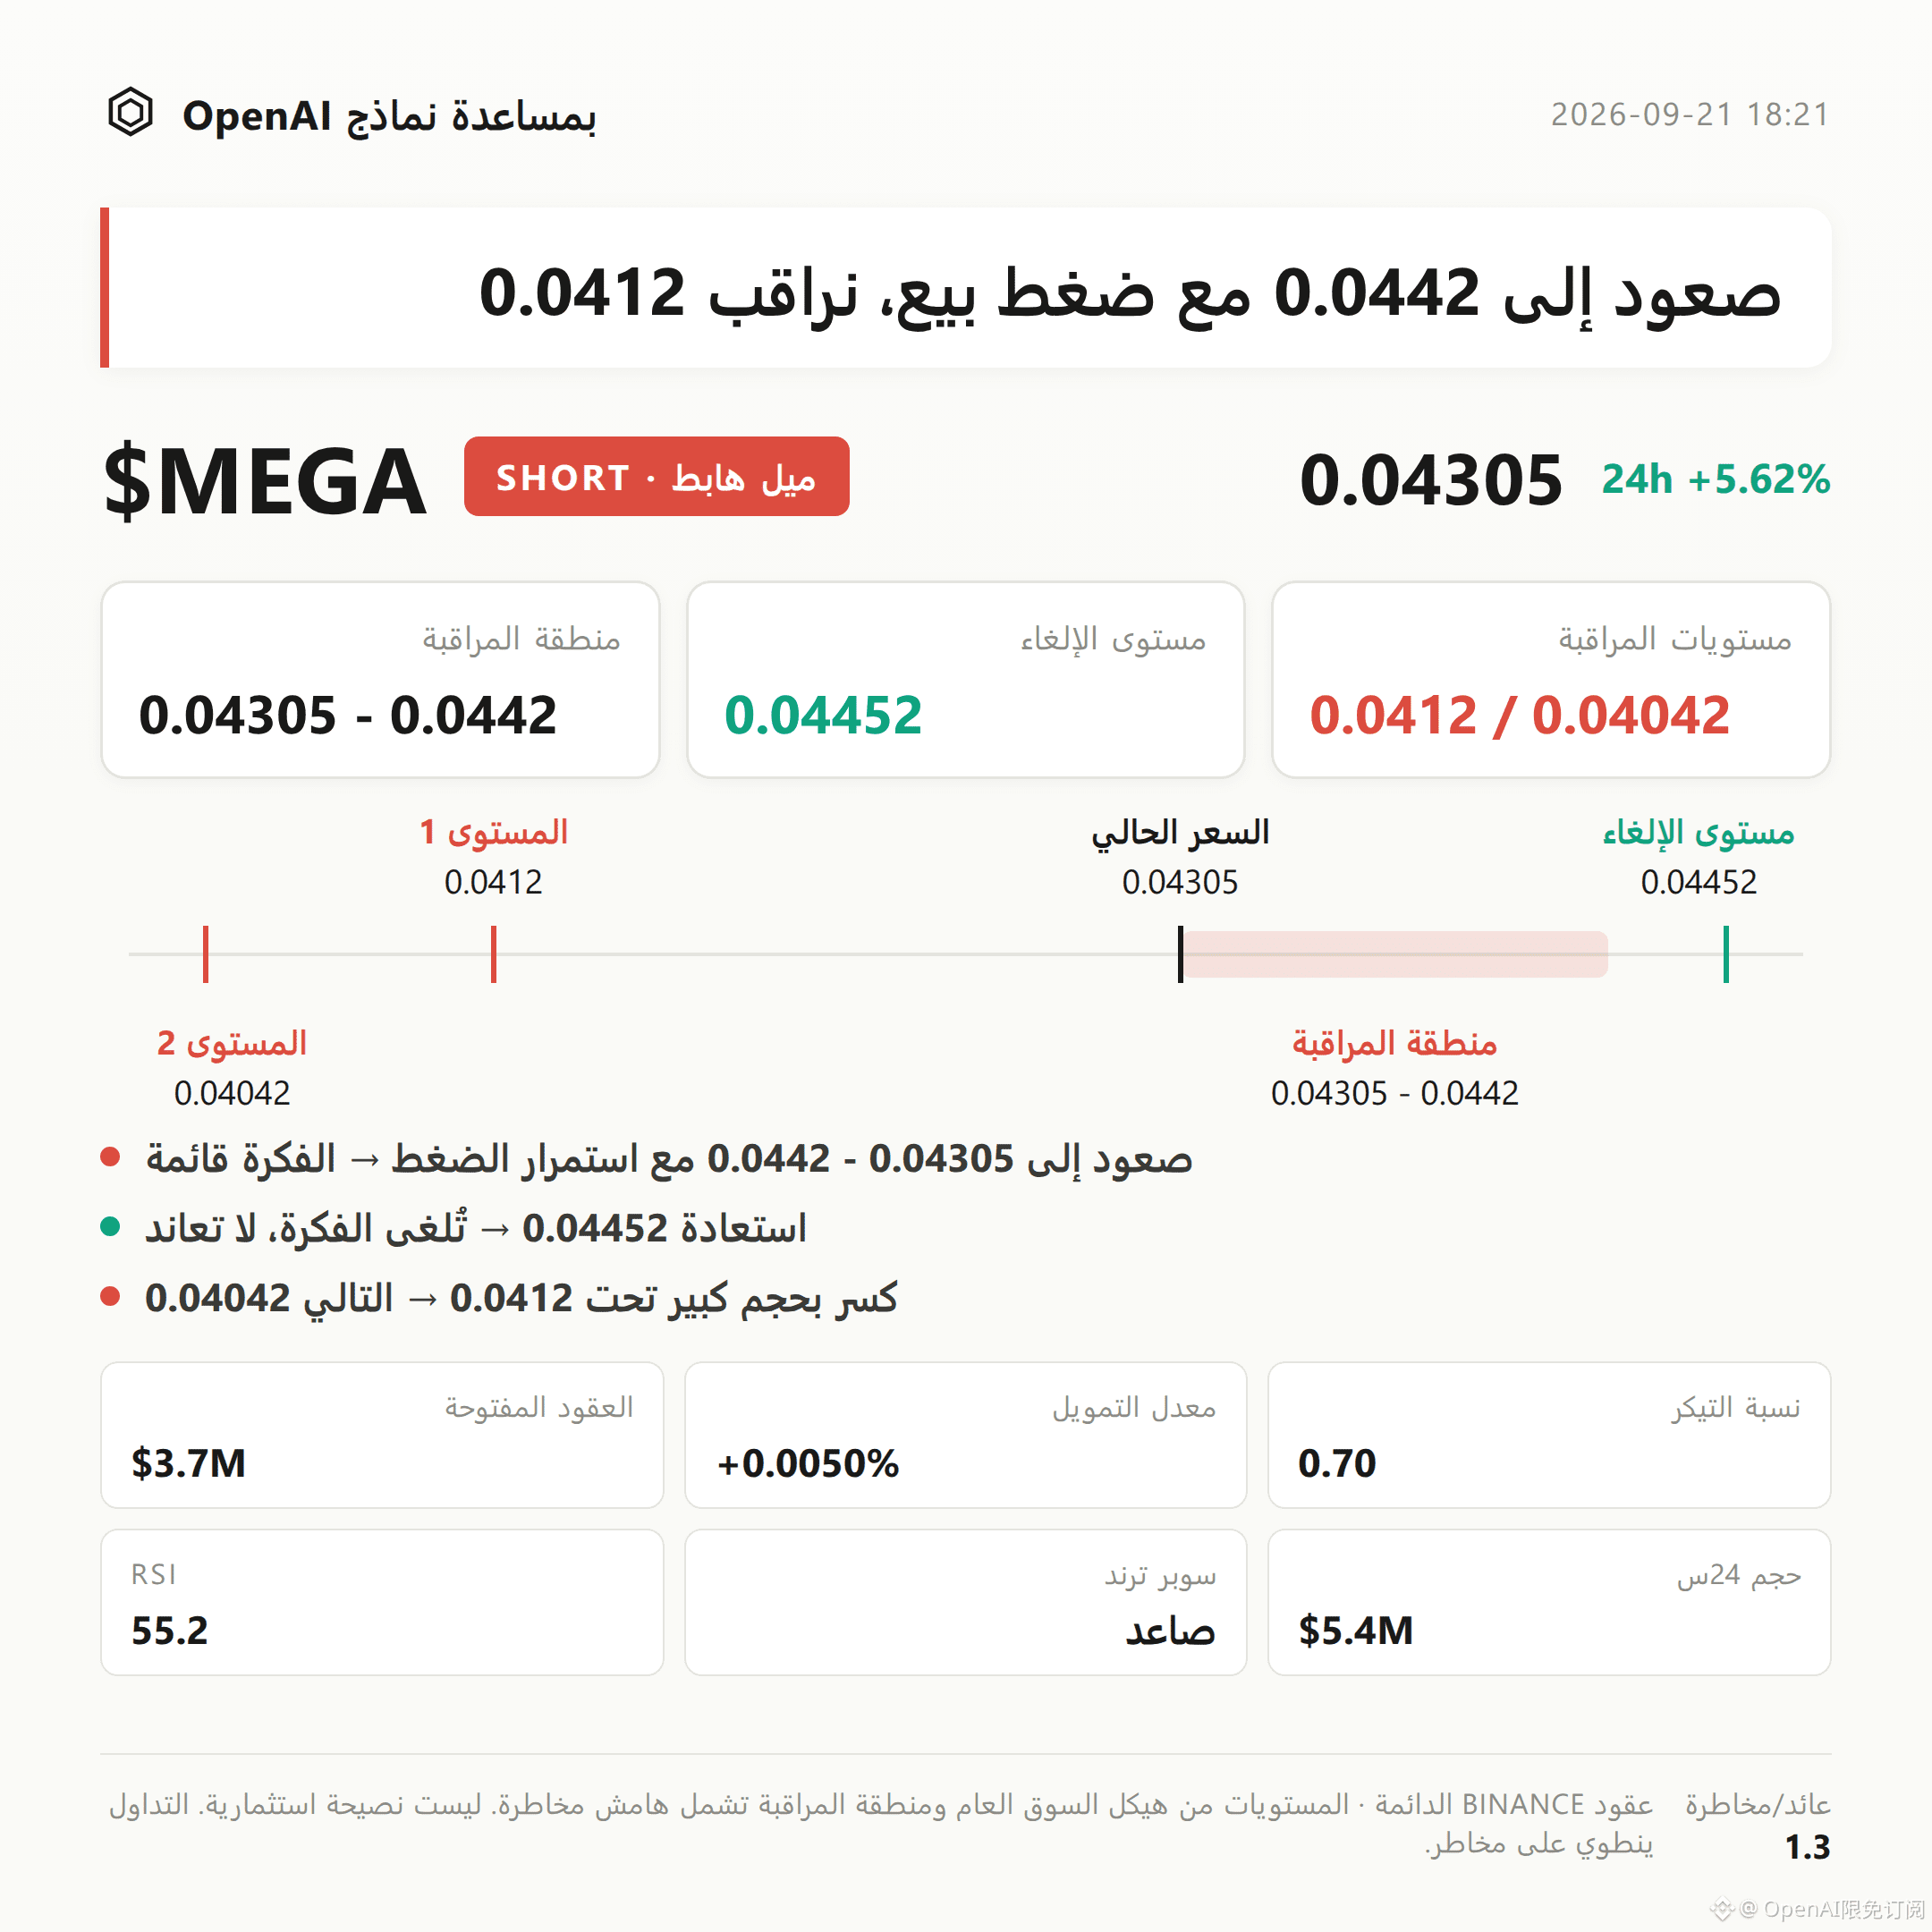
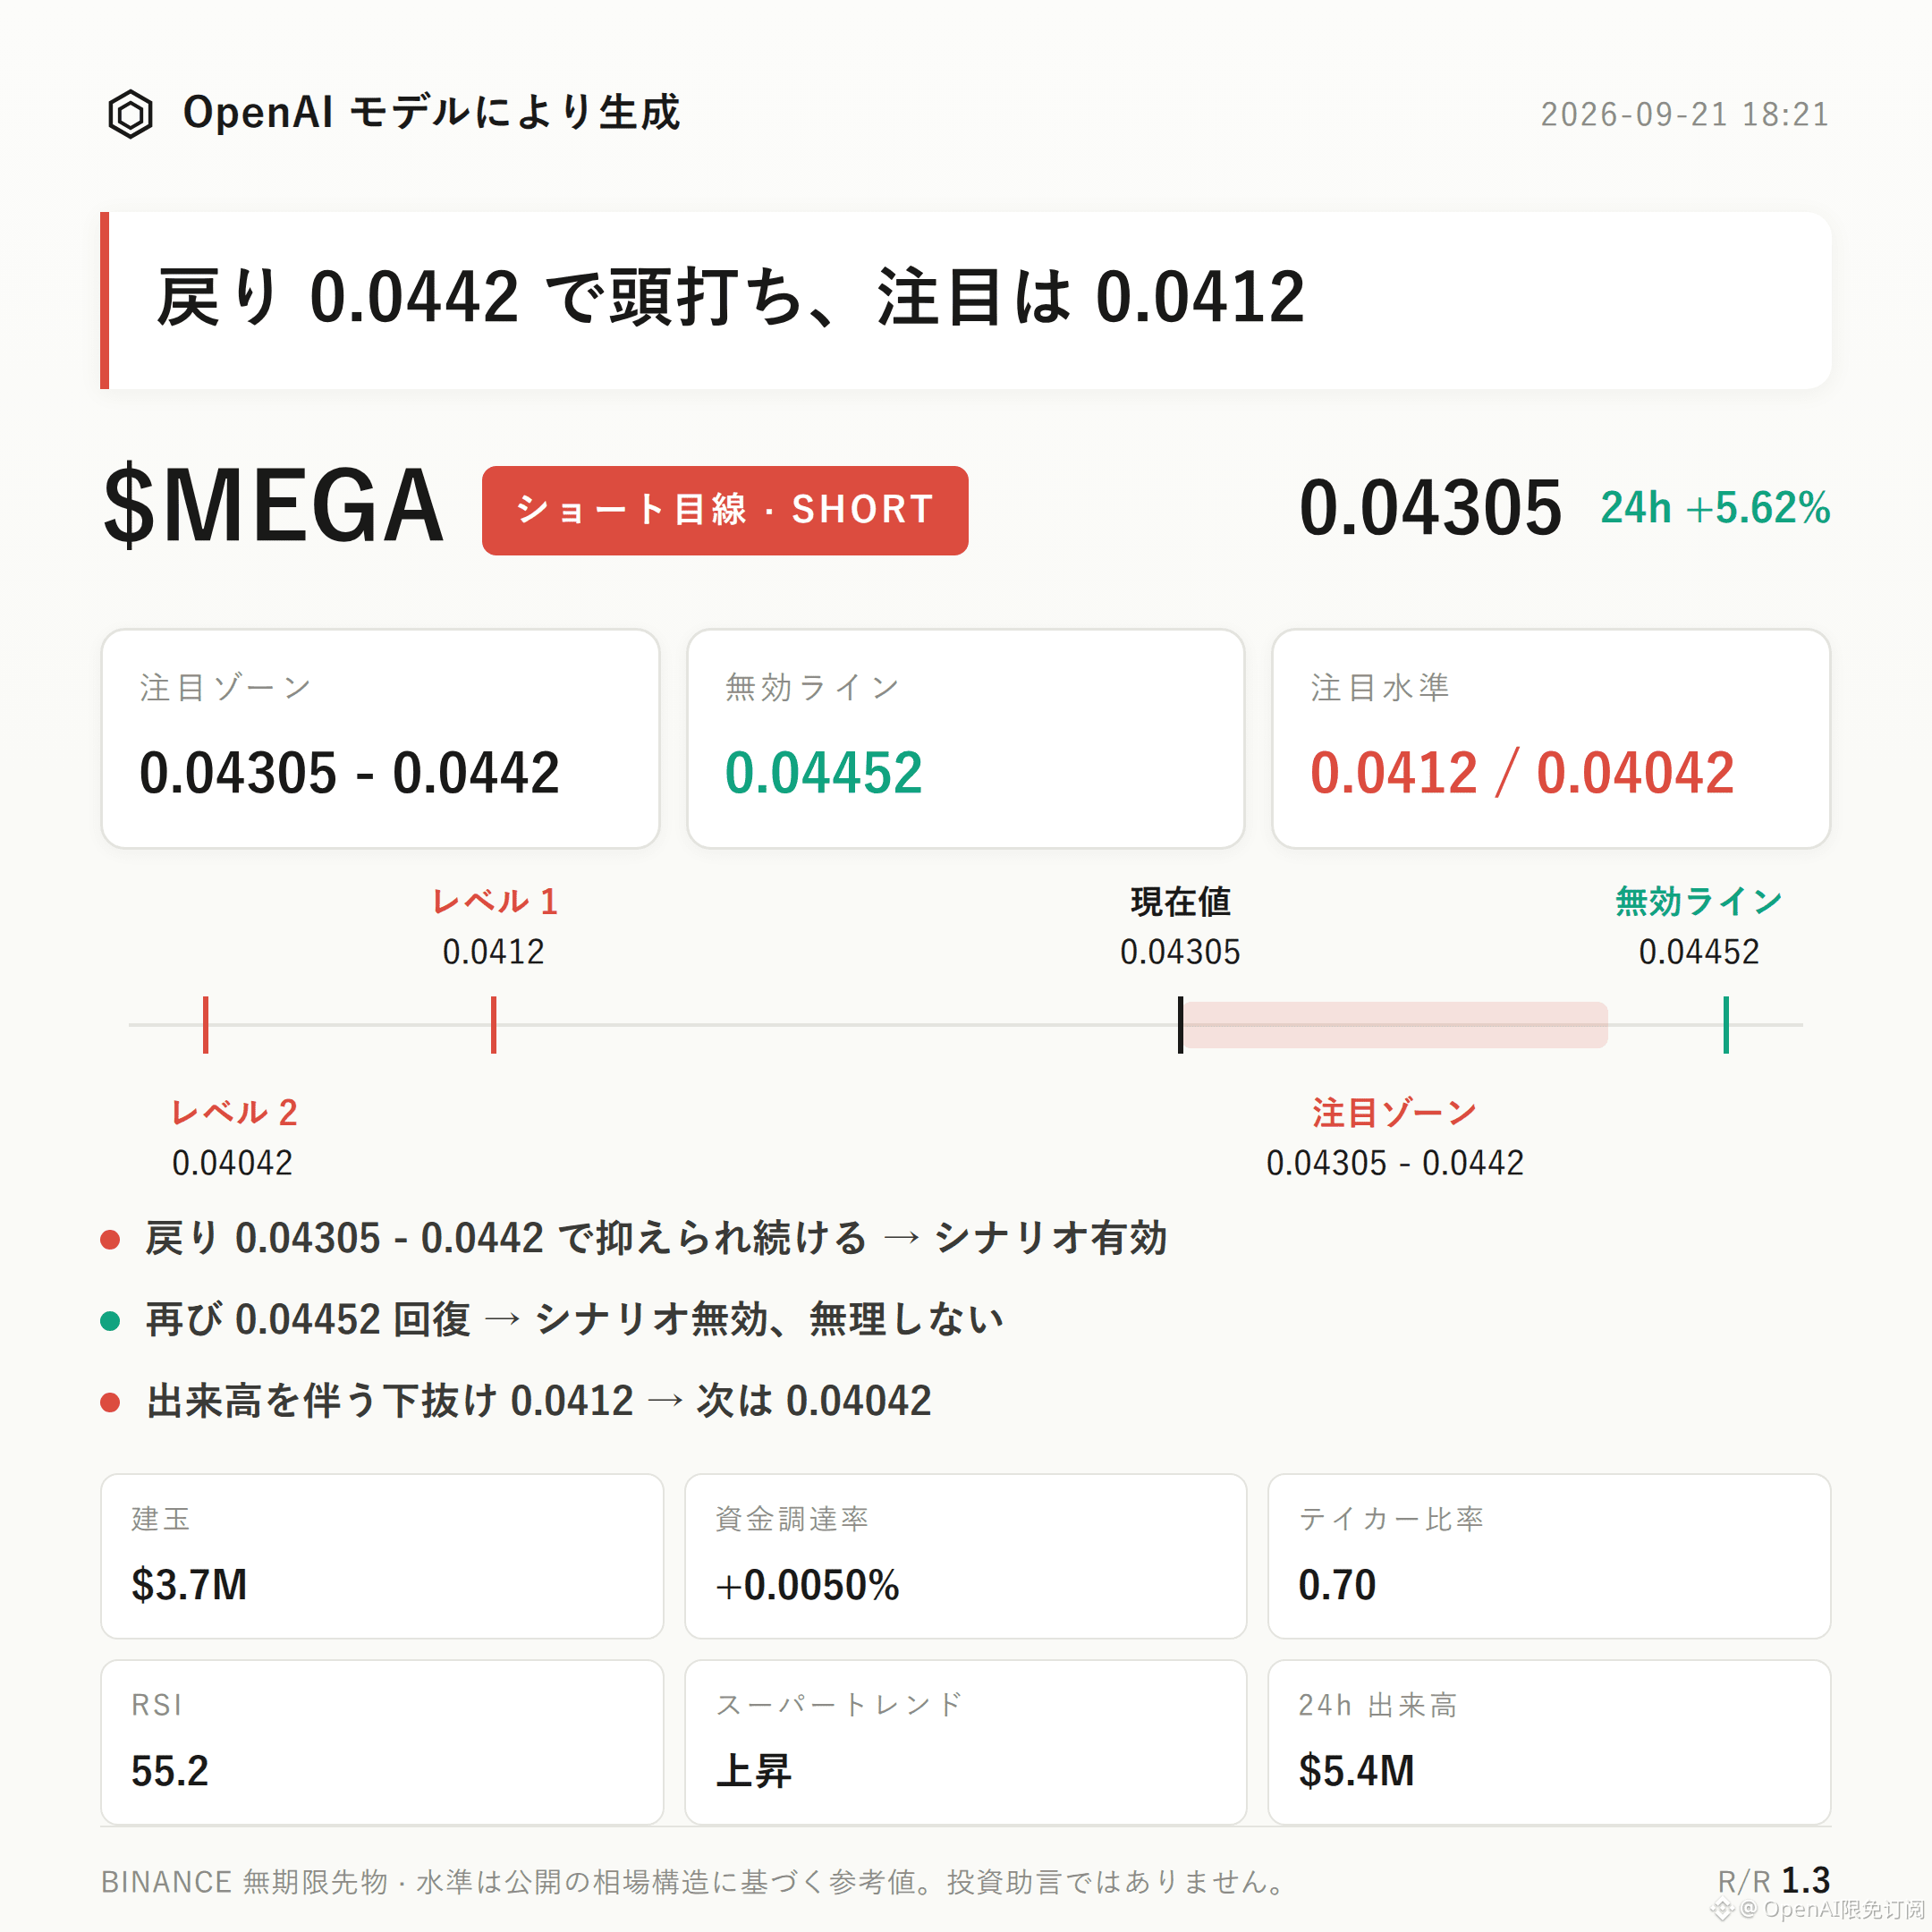
$MEGA Bearish Bias | Watch Zone 0.04305 - 0.0442 | Invalidation Reference 0.04452 | Observation Levels 0.0412 / 0.04042
$MEGA is currently unfolding a bearish-leaning structure.
The key arguments are: the buy/sell ratio of active orders is 0.70, indicating active sell orders are dominant; the current price 0.04305 is pressing against the upper Bollinger band 0.0442 and the pressure area around the recent high 0.04452; and open interest has increased by 17.1% in 24 hours, which is clearly faster than the price rise (+5.62%), suggesting leveraged longs are building up too quickly.
Next, the focus is whether the pullback/relief rebound can be capped within the 0.04305-0.0442 zone, and whether a volume-expansion stall (rising on declining momentum) appears.
In terms of structure, the current price is already near the recent high 0.04452 and the upper Bollinger band 0.0442—this range previously served as the top zone.
Need to state plainly: the SuperTrend reading is still pointing upward; MACD shows bullish momentum; RSI at 55.2 is in a neutral-to-bullish range. The technical side has not produced a clear weakening signal yet. The current bearish idea is more of a "pressure-area battle"—not a call for a trend reversal.
Only if the price repeatedly tests the watch zone without volume-supported consolidation, or if SuperTrend turns and price breaks below the Bollinger midline 0.0427, will it constitute further confirmation of weakness.
Over the past 24 hours, trading volume was $5.37M, and open interest is $3.69M with a +17.1% increase in 24 hours. The increase speed is faster than the同期 price rise.
Funding rate is only +0.0050%; the long account share is 56%. The fee rate not rising in sync suggests longs are adding exposure more through leverage rather than extreme sentiment.
The active buy/sell ratio is 0.70, meaning active sell orders dominate within the same统计窗口. This matches the signs of a stalled advance as price presses toward the previous high—this is the core basis for the bearish view in this post.
For bears, first watch the 0.04305-0.0442 zone. It is more suitable to wait for confirmation after the rebound meets resistance. If in this range you see volume-expansion stall or a clearly visible long upper wick, the bearish idea is temporarily valid.
The invalidation reference is 0.04452. If price rises back above this level, it means the current pullback structure is broken and the bearish idea is invalid—do not keep applying it.
For the downside, the next observation level is 0.0412. If it breaks down on volume, then look around 0.04042 for support. That level corresponds to the recent low; whether it holds determines whether the pullback continues.
For opposite risk, disclosure must be honest: MACD bullish momentum, SuperTrend upward, and RSI neutral-to-bullish. At the moment, there are no significant reverse signals that directly point to a downside move. This post is mainly based on the tug-of-war between active sell-order data and the pressure-zone battle, rather than trend confirmation. Even the reference risk/reward of 1.3 also suggests limited upside/downside room.
Contract leverage amplifies two-way volatility; position discipline is more important than directional judgment.
For reference only; it does not constitute investment advice. Contracts have leverage; investing involves risk.
This article was generated with assistance from an OpenAI large model.
$MEGA # Contract Analysis
$MEGA Bearish Bias | Watch Zone 0.04305 - 0.0442 | Invalidation Reference 0.04452 | Observation Levels 0.0412 / 0.04042
$MEGA is currently unfolding a bearish-leaning structure.
The key arguments are: the buy/sell ratio of active orders is 0.70, indicating active sell orders are dominant; the current price 0.04305 is pressing against the upper Bollinger band 0.0442 and the pressure area around the recent high 0.04452; and open interest has increased by 17.1% in 24 hours, which is clearly faster than the price rise (+5.62%), suggesting leveraged longs are building up too quickly.
Next, the focus is whether the pullback/relief rebound can be capped within the 0.04305-0.0442 zone, and whether a volume-expansion stall (rising on declining momentum) appears.
In terms of structure, the current price is already near the recent high 0.04452 and the upper Bollinger band 0.0442—this range previously served as the top zone.
Need to state plainly: the SuperTrend reading is still pointing upward; MACD shows bullish momentum; RSI at 55.2 is in a neutral-to-bullish range. The technical side has not produced a clear weakening signal yet. The current bearish idea is more of a "pressure-area battle"—not a call for a trend reversal.
Only if the price repeatedly tests the watch zone without volume-supported consolidation, or if SuperTrend turns and price breaks below the Bollinger midline 0.0427, will it constitute further confirmation of weakness.
Over the past 24 hours, trading volume was $5.37M, and open interest is $3.69M with a +17.1% increase in 24 hours. The increase speed is faster than the同期 price rise.
Funding rate is only +0.0050%; the long account share is 56%. The fee rate not rising in sync suggests longs are adding exposure more through leverage rather than extreme sentiment.
The active buy/sell ratio is 0.70, meaning active sell orders dominate within the same统计窗口. This matches the signs of a stalled advance as price presses toward the previous high—this is the core basis for the bearish view in this post.
For bears, first watch the 0.04305-0.0442 zone. It is more suitable to wait for confirmation after the rebound meets resistance. If in this range you see volume-expansion stall or a clearly visible long upper wick, the bearish idea is temporarily valid.
The invalidation reference is 0.04452. If price rises back above this level, it means the current pullback structure is broken and the bearish idea is invalid—do not keep applying it.
For the downside, the next observation level is 0.0412. If it breaks down on volume, then look around 0.04042 for support. That level corresponds to the recent low; whether it holds determines whether the pullback continues.
For opposite risk, disclosure must be honest: MACD bullish momentum, SuperTrend upward, and RSI neutral-to-bullish. At the moment, there are no significant reverse signals that directly point to a downside move. This post is mainly based on the tug-of-war between active sell-order data and the pressure-zone battle, rather than trend confirmation. Even the reference risk/reward of 1.3 also suggests limited upside/downside room.
Contract leverage amplifies two-way volatility; position discipline is more important than directional judgment.
For reference only; it does not constitute investment advice. Contracts have leverage; investing involves risk.
This article was generated with assistance from an OpenAI large model.
$MEGA # Contract Analysis