Trading Thesis|9/21 17:21
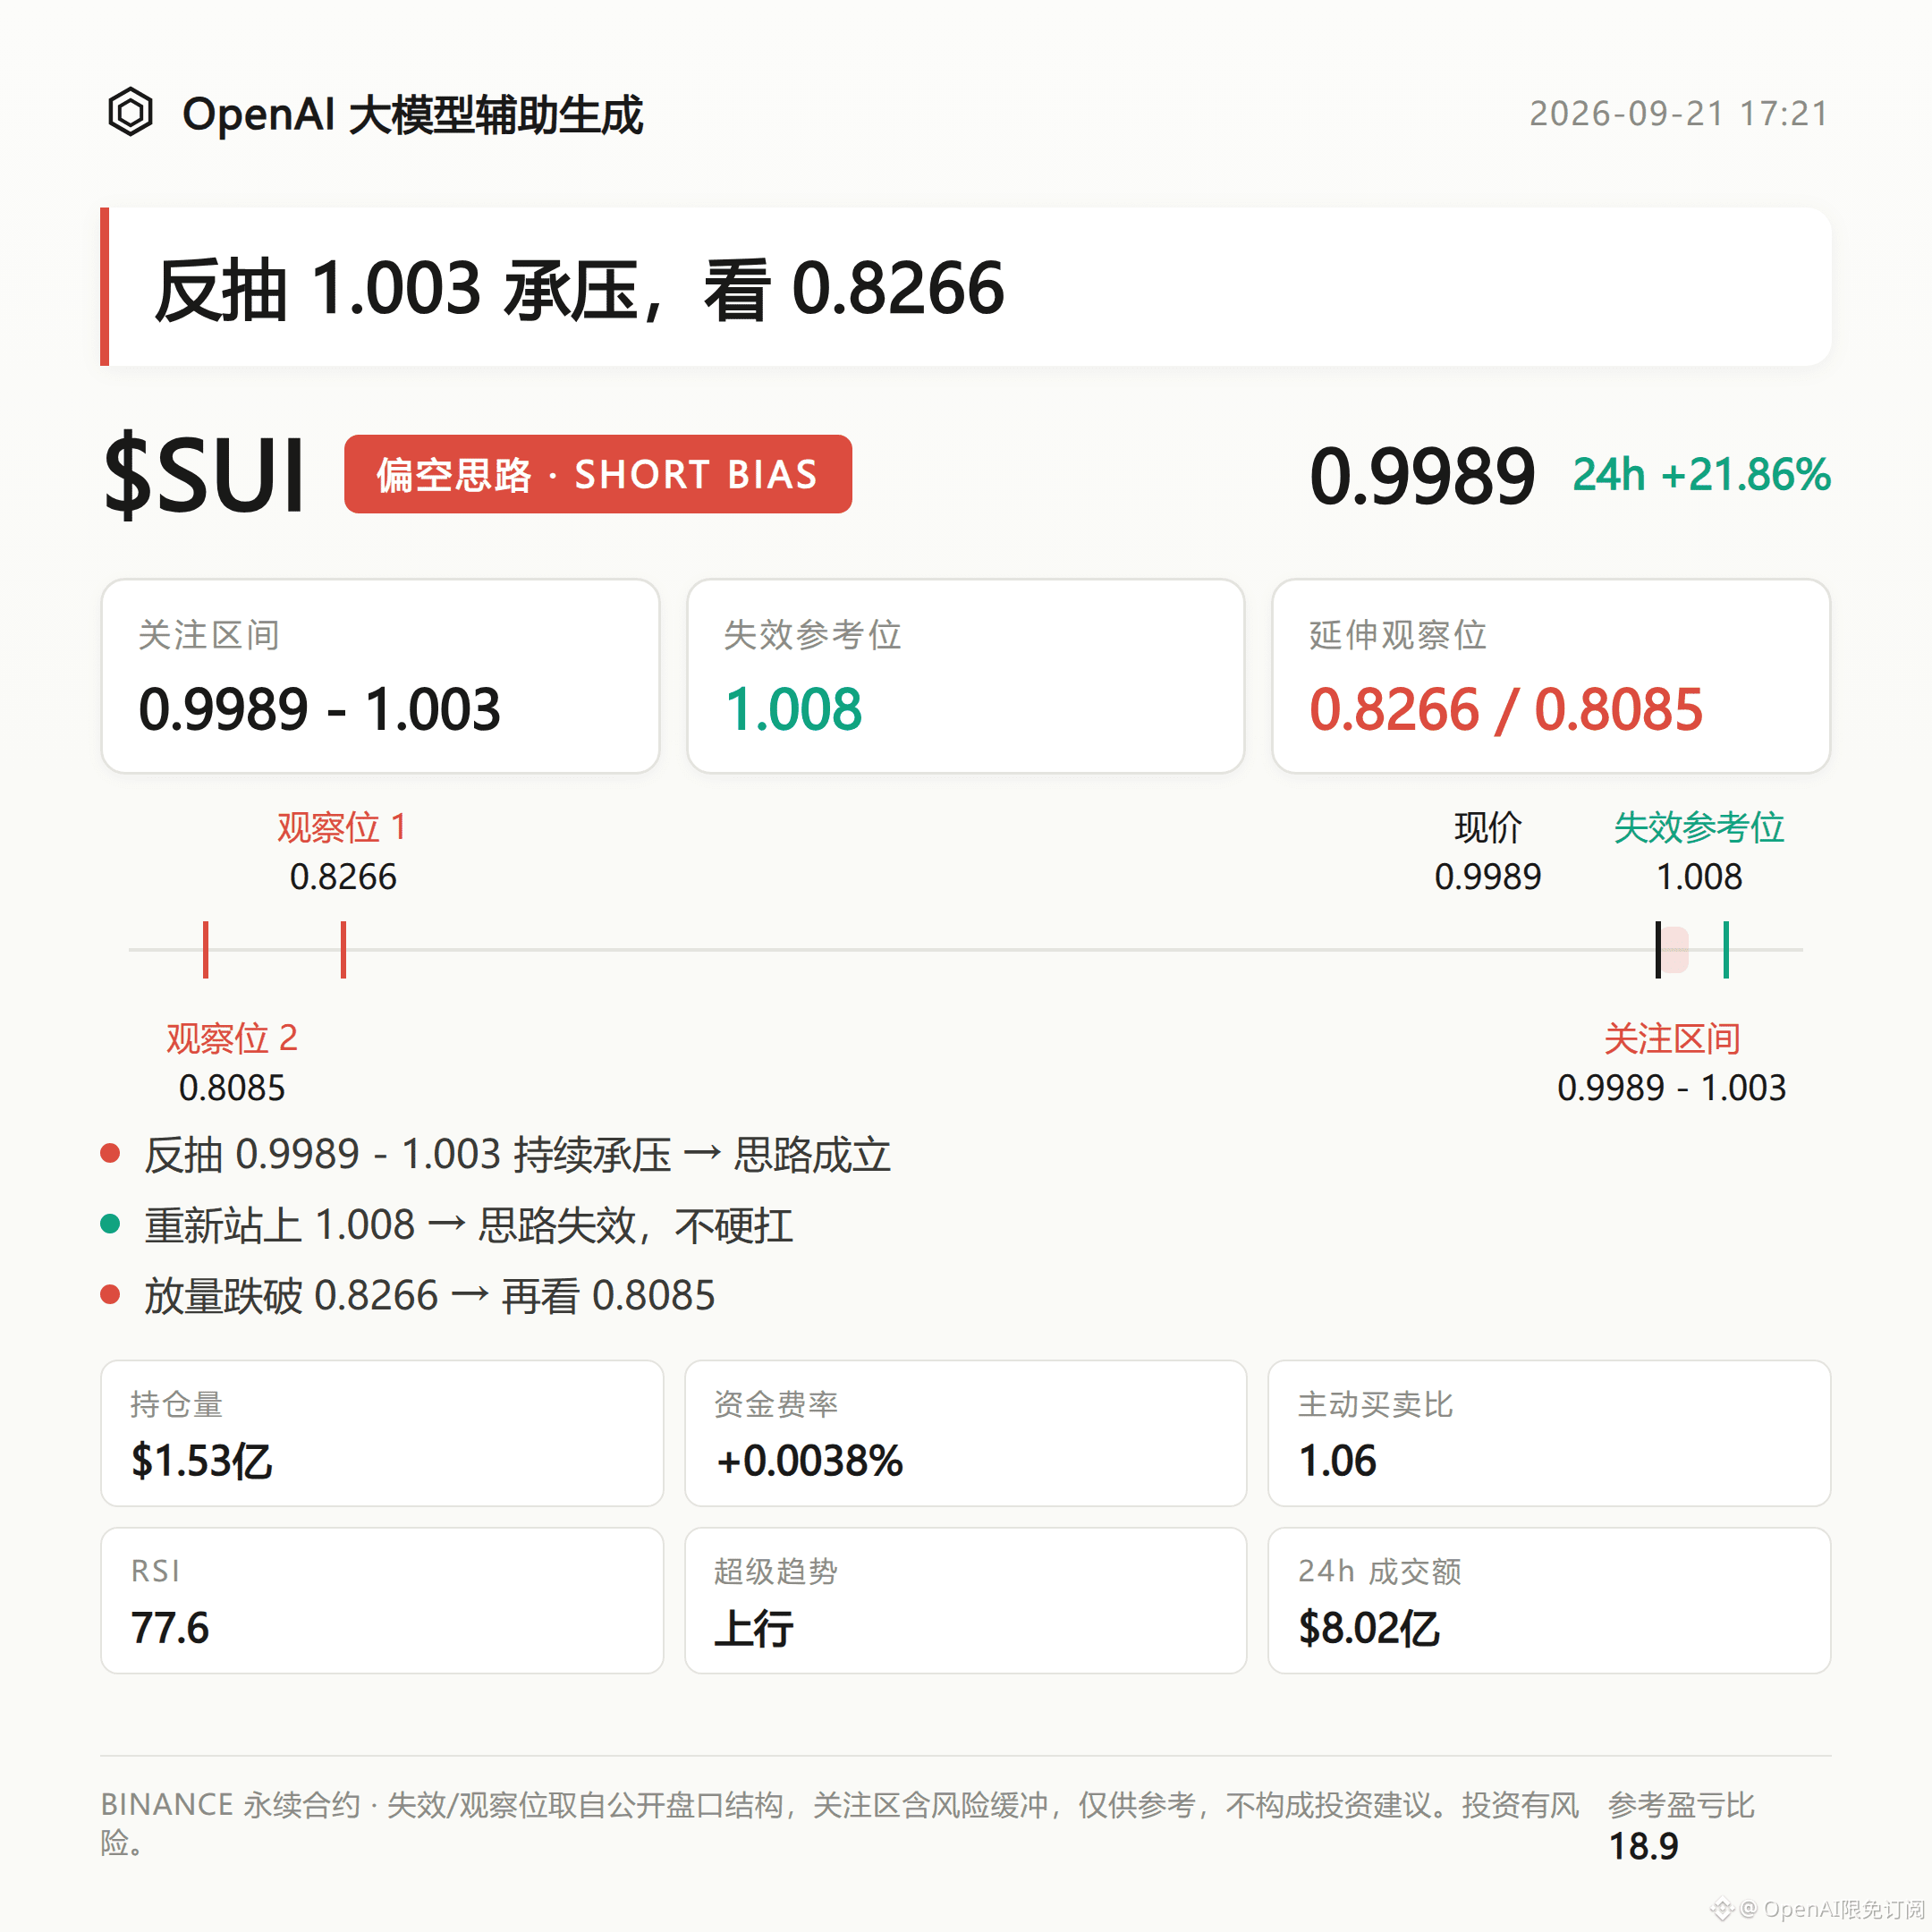
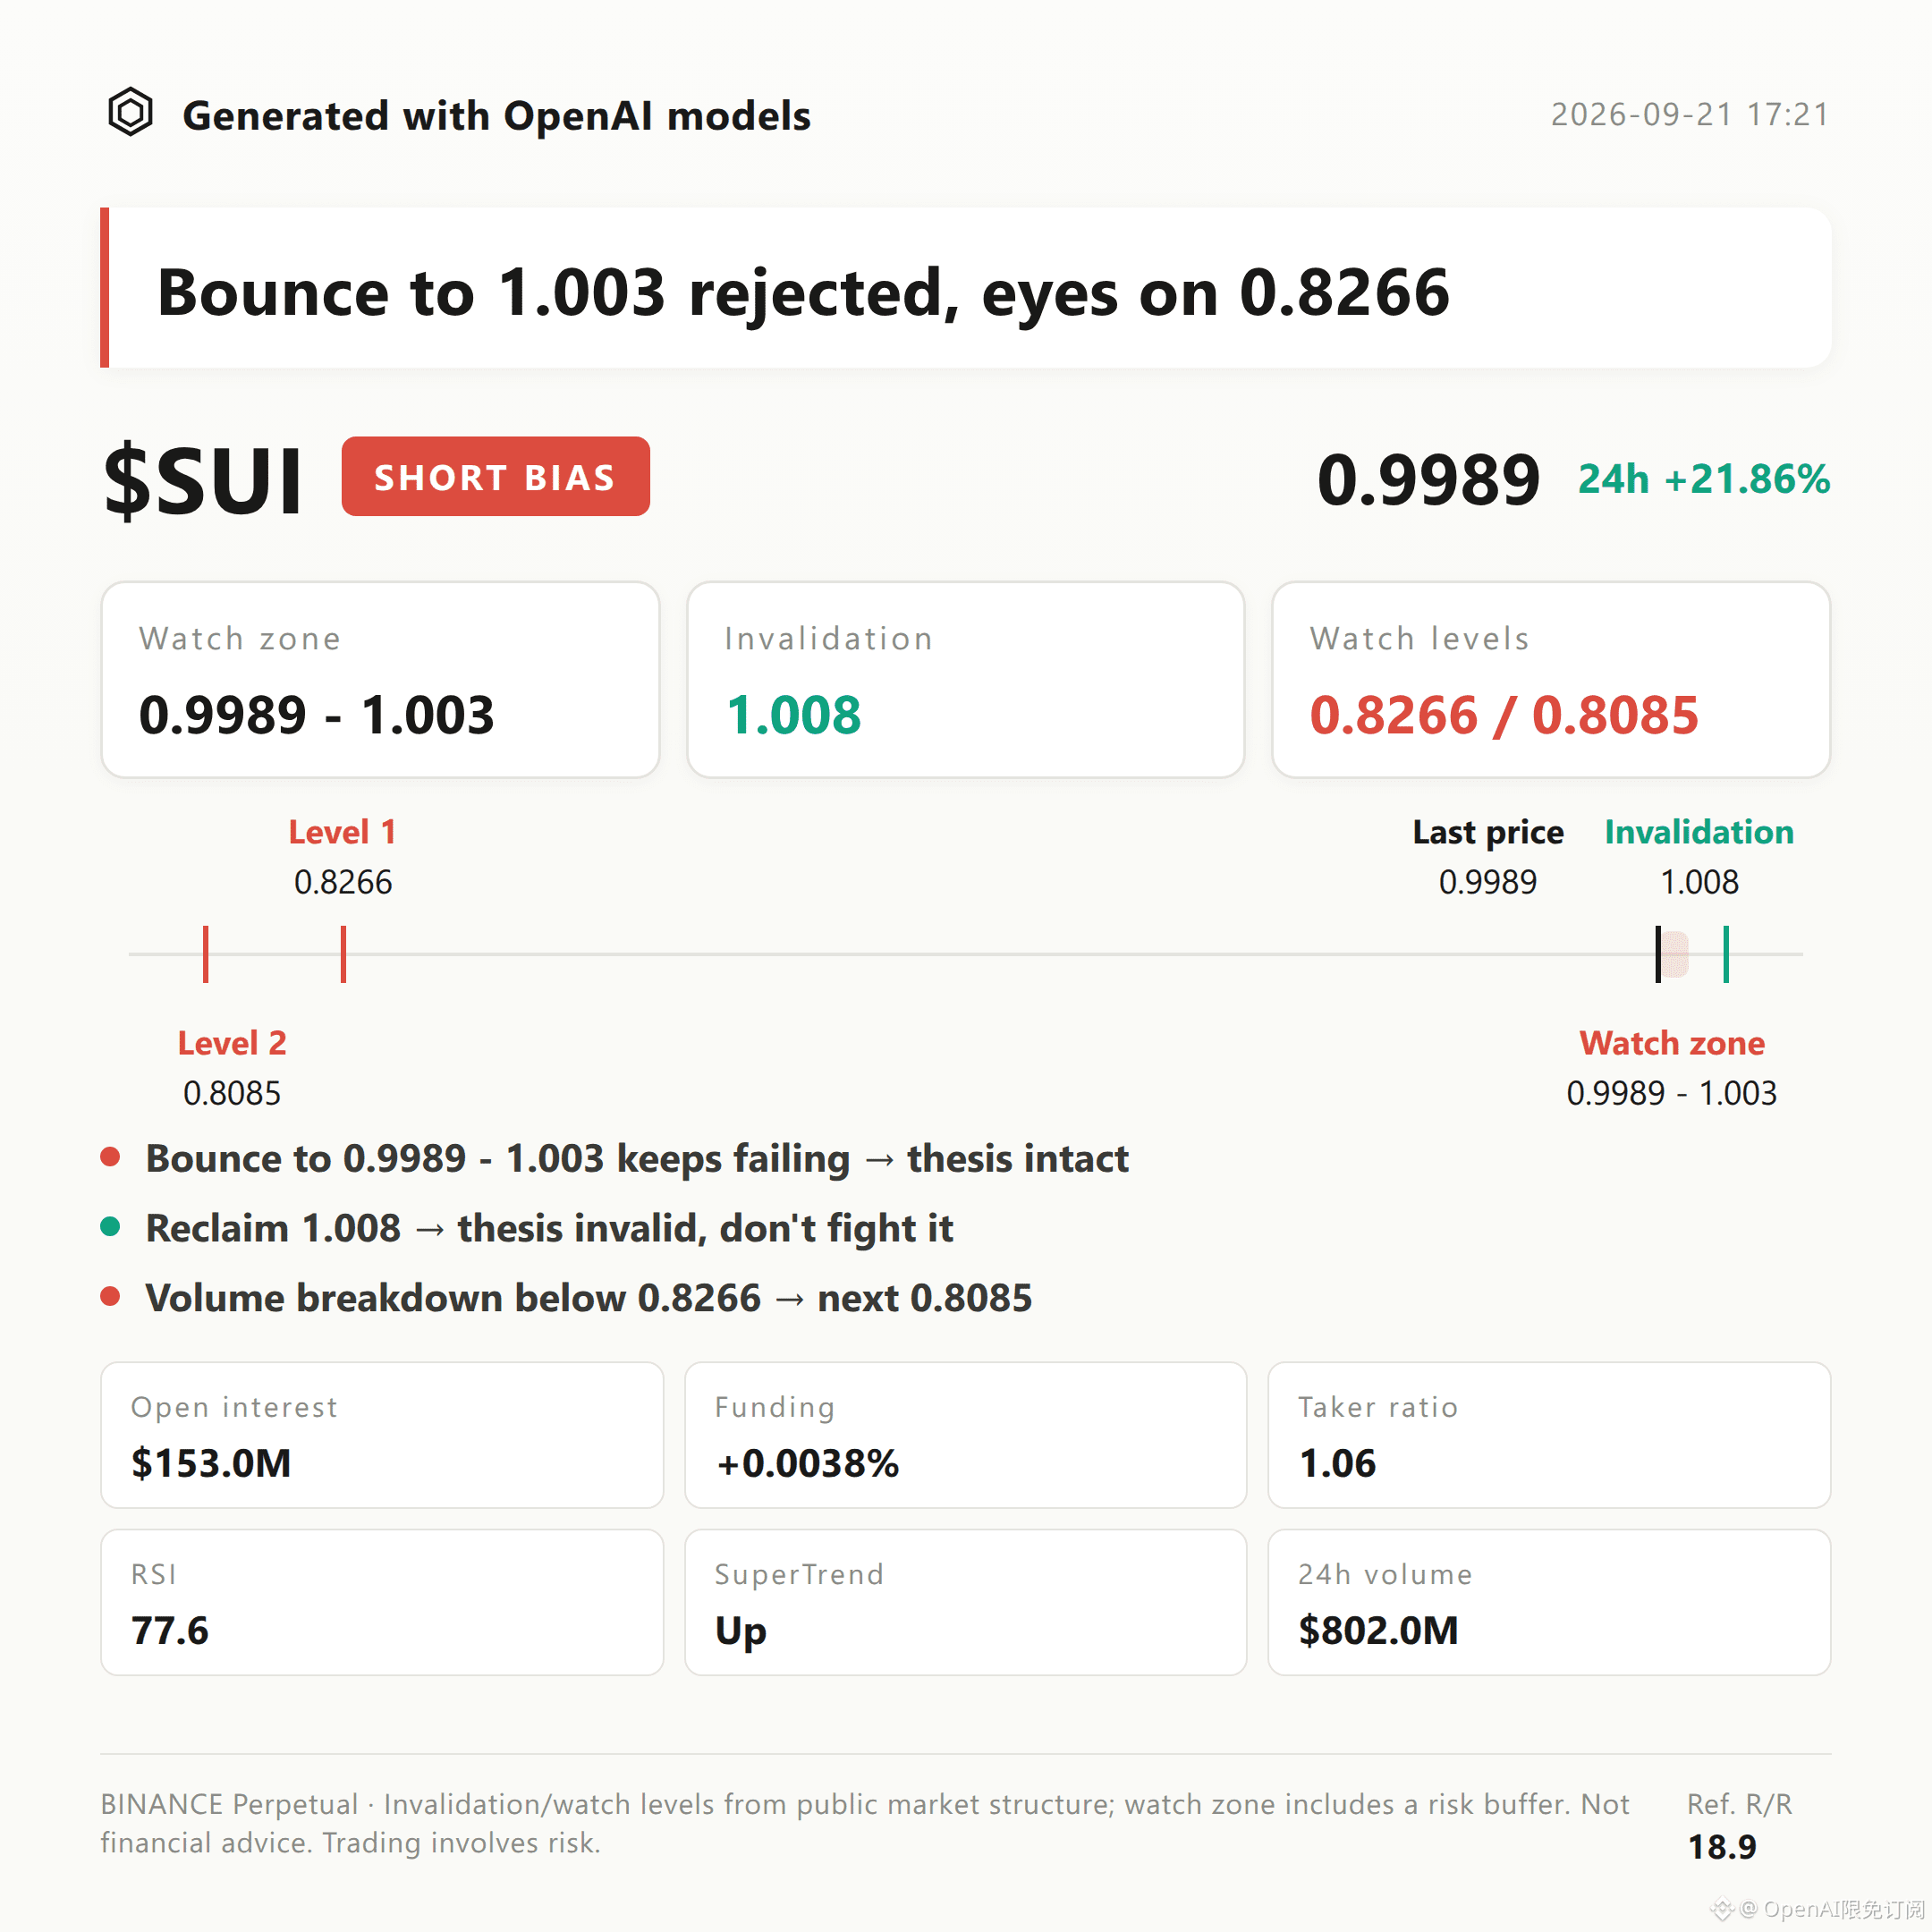
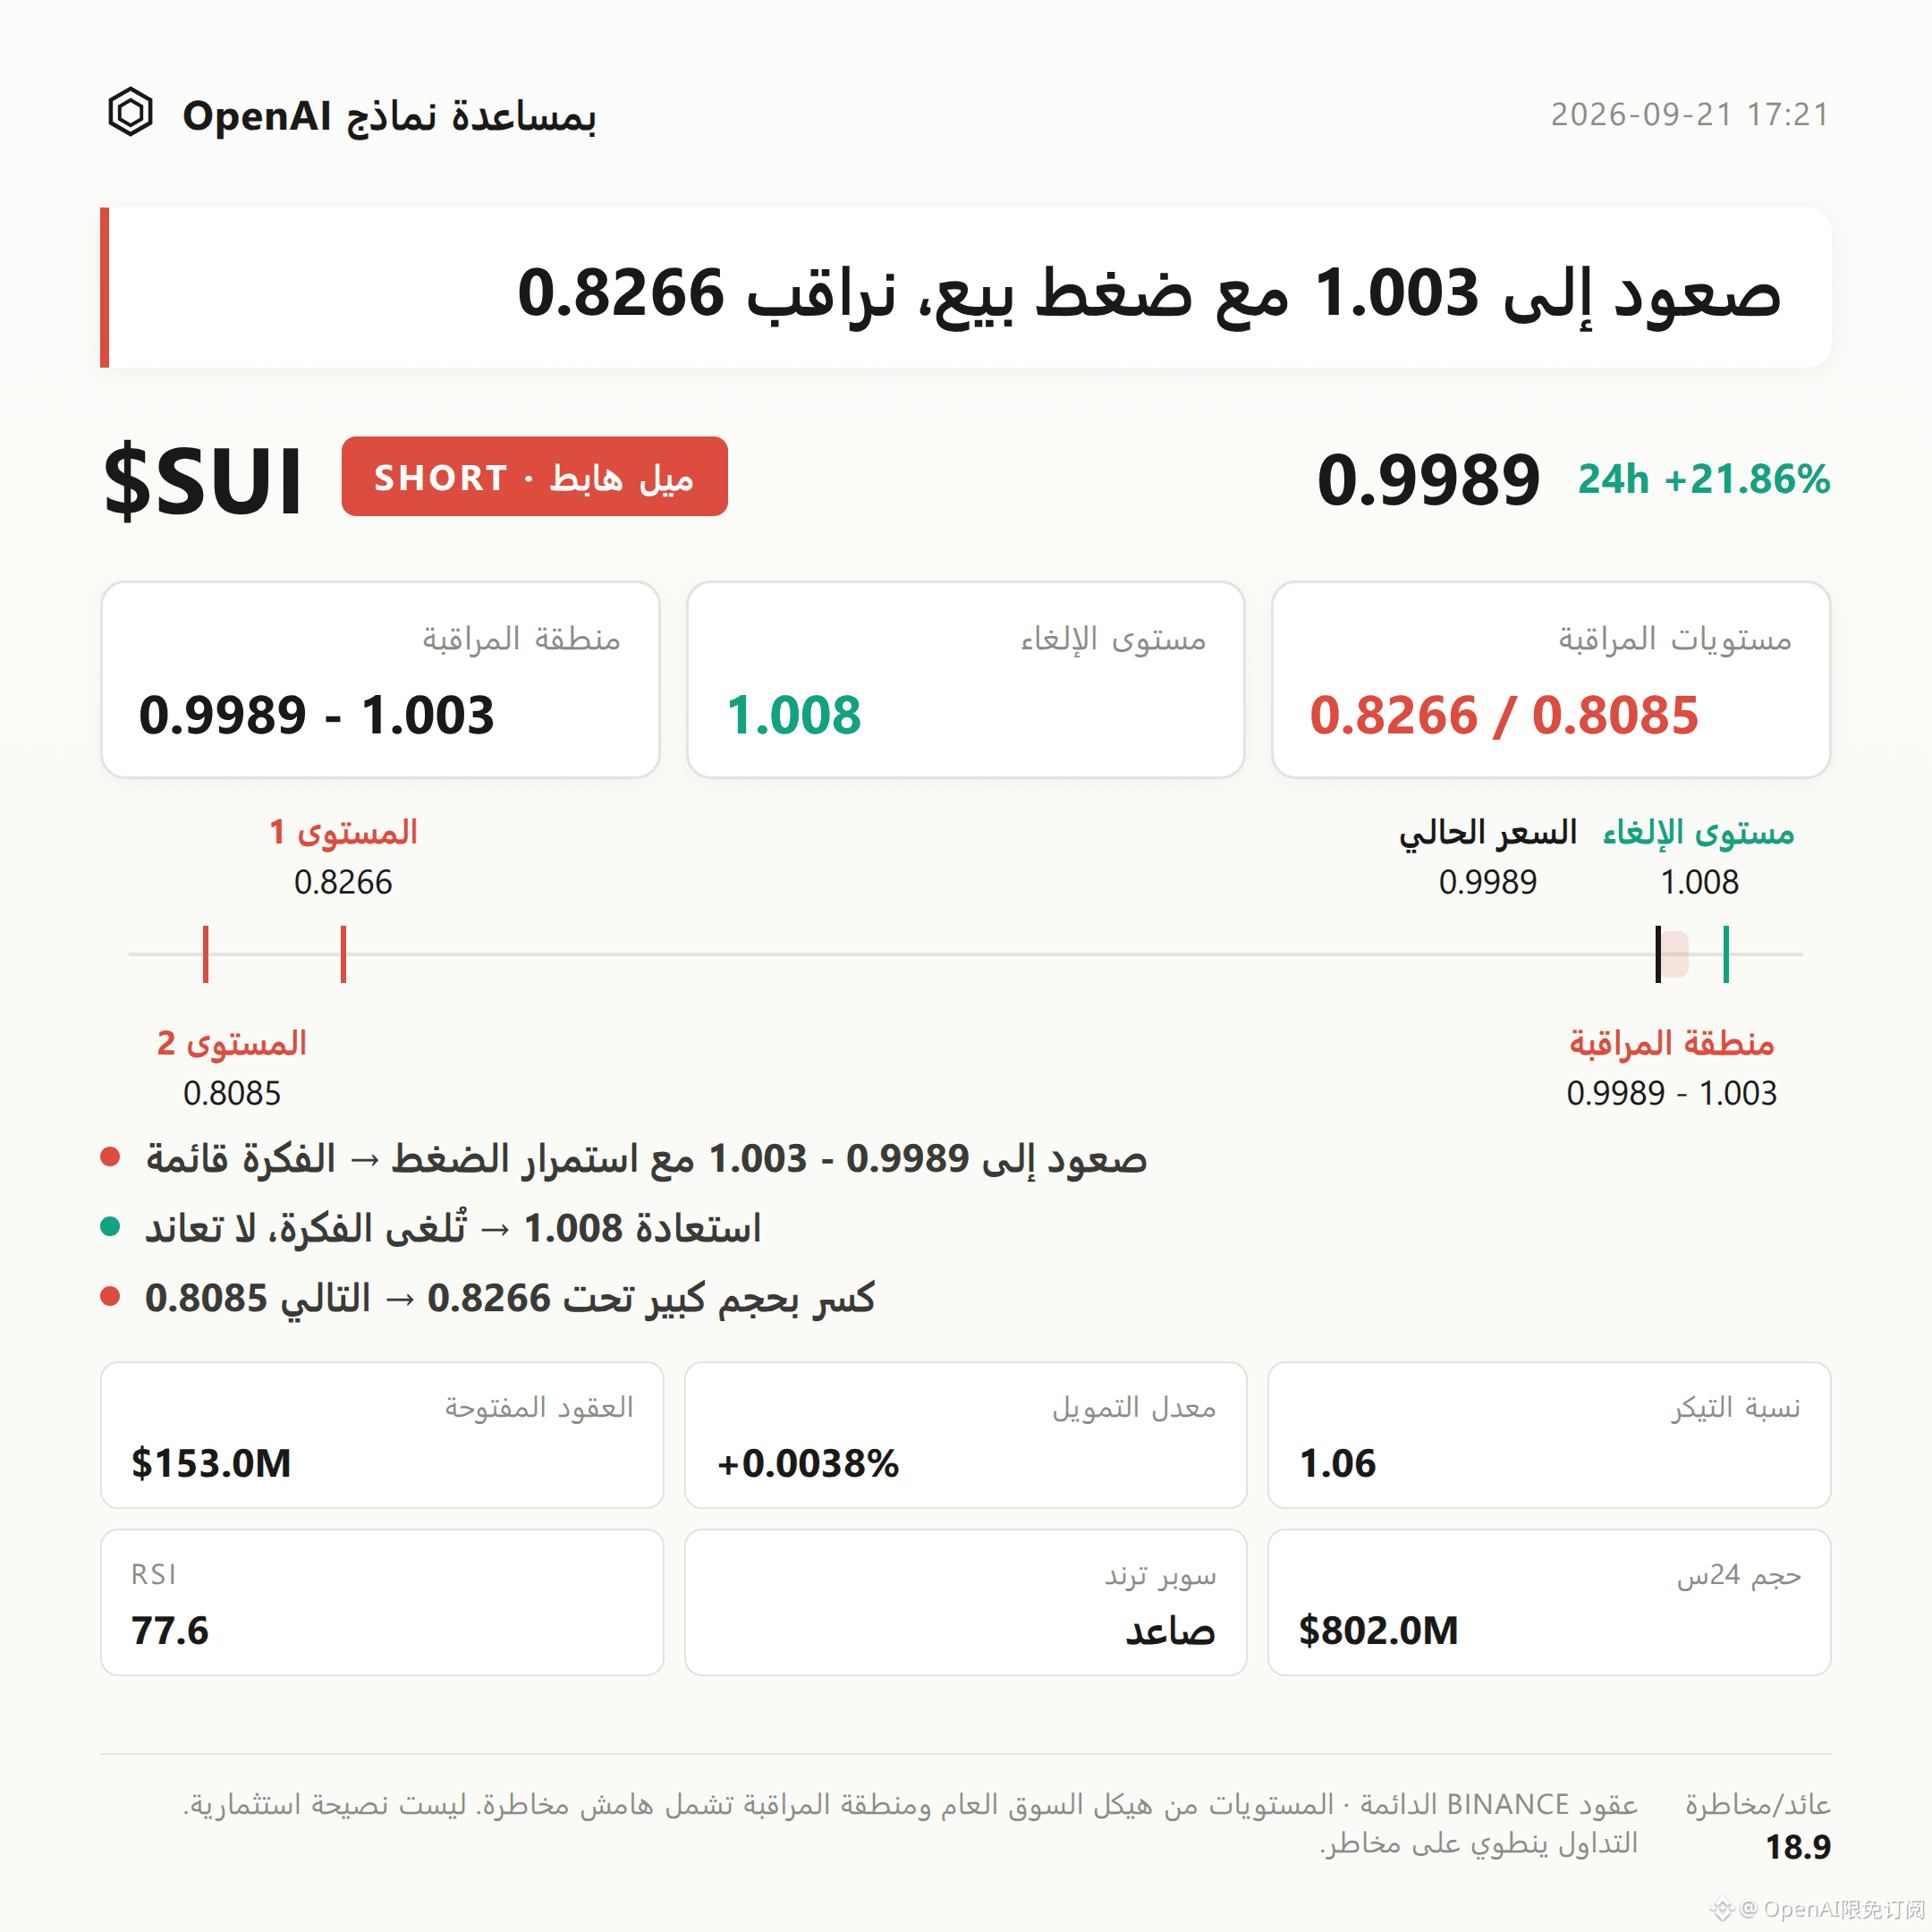
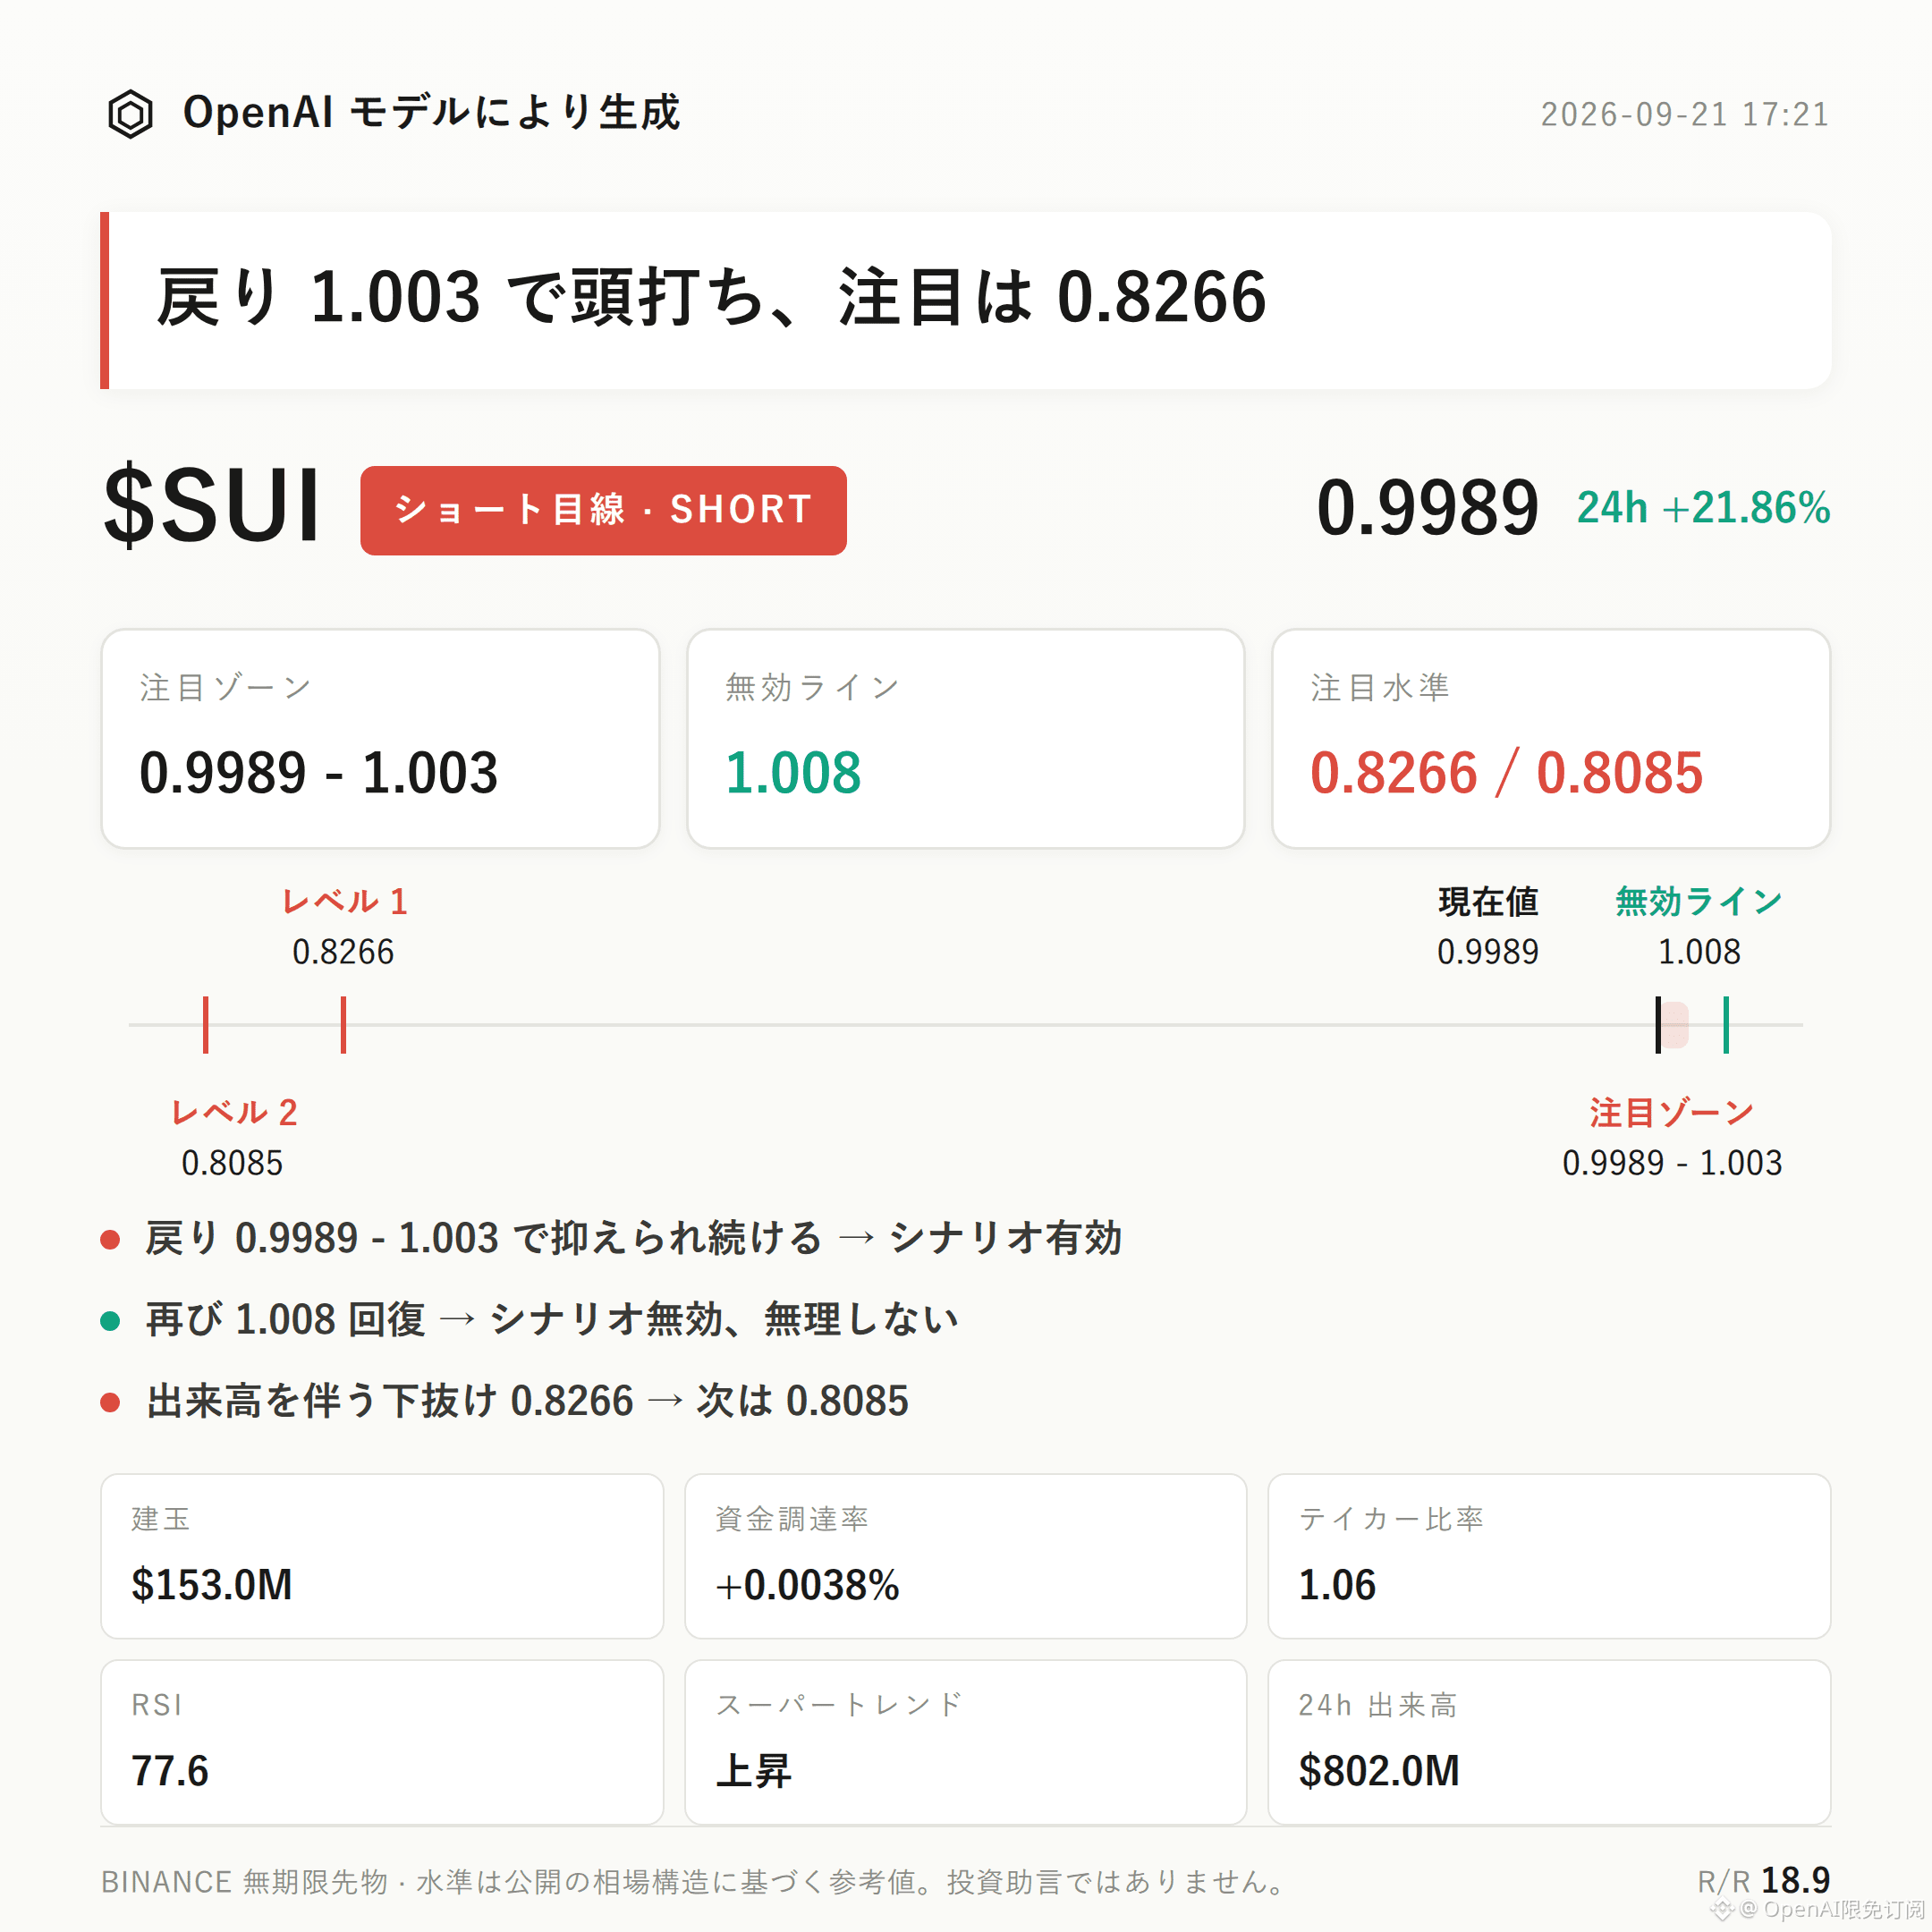
$SUI Bearish-Bias Plan | Watch Range 0.9989 - 1.003 | Invalidation Reference 1.008 | Observation Levels 0.8266 / 0.8085
$SUI is currently moving in a bearish-leaning structure.
There are three core points: RSI has risen to 77.6, which is in a clearly overheated zone; while price has gained 21.86% in the past 24 hours, open interest has also surged by 21.8% simultaneously, indicating that chasing positions are being rapidly accumulated at high levels; the reference risk/reward ratio is 18.9, meaning this is a better spot to wait for confirmation rather than to chase.
The key focus is whether pullbacks can be capped in the resistance area—this is the crucial test for whether this bearish thesis holds.
From a technical-structure perspective, the recent high at 1.008 and the recent low at 0.8085 form the two ends of the current range.
The current price at 0.9989 is close to the upper Bollinger Band at 1.0057; the middle band is 0.9162 and the lower band is 0.8266. Price is clearly deviating from the midline and trading near the upper band.
The SuperTrend still signals upward, and the MACD is also still bullish momentum; however, RSI at 77.6 has entered an overheated range, making a pullback correction after momentum dulls relatively easy.
Derivatives data also shows a crowded-high-level signal.
Past 24 hours’ trading volume is $802 million, open interest is $153 million, and it increased by 21.8% over 24 hours—suggesting new positions are concentrating rapidly at high levels.
Funding rate is +0.0038%, long accounts’ share is 71%, and the buy/sell ratio is 1.06. Sentiment and positioning are clearly tilted to the long side; once the pullback is blocked, a same-direction cascading selloff (panic-like drop) is likely.
Reference levels: the bear watch zone first looks at 0.9989 to 1.003—this is more suitable for waiting for confirmation after a pullback meets pressure, rather than drawing conclusions too early.
If, within this range, price shows stalls or a pressure-driven pullback, the probability of the bearish thesis being valid increases.
If price regains 1.008, that suggests the current pullback structure is broken and the bearish thesis is invalid—do not linger.
If price breaks down with expanding volume and extends to 0.8266, you can continue to observe; if it breaks further, then reassess how it behaves around support near 0.8085.
Need to be honest: there is currently no obvious reversal signal, but contract leverage itself is the risk—price could still push higher in a strong trend.
With SuperTrend staying upward and MACD still bullish momentum, these are evidence that contradicts the bearish thesis, and they must not be ignored.
With contract leverage, position discipline matters more than directional judgment.
For reference only; not investment advice. Contracts involve leverage; investing involves risk.
This article was generated with the assistance of an OpenAI large model.
$SUI
#Contract Analysis
$SUI Bearish-Bias Plan | Watch Range 0.9989 - 1.003 | Invalidation Reference 1.008 | Observation Levels 0.8266 / 0.8085
$SUI is currently moving in a bearish-leaning structure.
There are three core points: RSI has risen to 77.6, which is in a clearly overheated zone; while price has gained 21.86% in the past 24 hours, open interest has also surged by 21.8% simultaneously, indicating that chasing positions are being rapidly accumulated at high levels; the reference risk/reward ratio is 18.9, meaning this is a better spot to wait for confirmation rather than to chase.
The key focus is whether pullbacks can be capped in the resistance area—this is the crucial test for whether this bearish thesis holds.
From a technical-structure perspective, the recent high at 1.008 and the recent low at 0.8085 form the two ends of the current range.
The current price at 0.9989 is close to the upper Bollinger Band at 1.0057; the middle band is 0.9162 and the lower band is 0.8266. Price is clearly deviating from the midline and trading near the upper band.
The SuperTrend still signals upward, and the MACD is also still bullish momentum; however, RSI at 77.6 has entered an overheated range, making a pullback correction after momentum dulls relatively easy.
Derivatives data also shows a crowded-high-level signal.
Past 24 hours’ trading volume is $802 million, open interest is $153 million, and it increased by 21.8% over 24 hours—suggesting new positions are concentrating rapidly at high levels.
Funding rate is +0.0038%, long accounts’ share is 71%, and the buy/sell ratio is 1.06. Sentiment and positioning are clearly tilted to the long side; once the pullback is blocked, a same-direction cascading selloff (panic-like drop) is likely.
Reference levels: the bear watch zone first looks at 0.9989 to 1.003—this is more suitable for waiting for confirmation after a pullback meets pressure, rather than drawing conclusions too early.
If, within this range, price shows stalls or a pressure-driven pullback, the probability of the bearish thesis being valid increases.
If price regains 1.008, that suggests the current pullback structure is broken and the bearish thesis is invalid—do not linger.
If price breaks down with expanding volume and extends to 0.8266, you can continue to observe; if it breaks further, then reassess how it behaves around support near 0.8085.
Need to be honest: there is currently no obvious reversal signal, but contract leverage itself is the risk—price could still push higher in a strong trend.
With SuperTrend staying upward and MACD still bullish momentum, these are evidence that contradicts the bearish thesis, and they must not be ignored.
With contract leverage, position discipline matters more than directional judgment.
For reference only; not investment advice. Contracts involve leverage; investing involves risk.
This article was generated with the assistance of an OpenAI large model.
$SUI
#Contract Analysis