


Last week, the Federal Reserve’s interest rate decision landed as expected. BTC completed a round of “first building up strength, then breaking out” between $74,950 and $81,950, which closely matched the “Path Two” scenario we had outlined earlier. According to our plan, we established long positions at the multi-factor confluence point after the decision announcement. When the price stalled near the $82,850 resistance zone and showed a top-confluence signal, we promptly closed the position. A quick trade yielded about a 4.76% return.
Meanwhile, HYPE staged a strong rebound after touching a low near $75. On September 19, it set a new all-time high of $94.52. Our assessment that “the uptrend on the daily chart ended and a pullback would follow” was fully validated during the retracement.
Entering this week, both of the two key assets are positioned at critical levels: BTC is approaching the box’s upper boundary at $82,850, while HYPE is near its historical new high and is in a deep overbought range. Our “spread trading model” has triggered top-warning signals one after another, and the “momentum quantification model” has also shown top-dulling in sync. The closer the price gets to the high zone, the more restraint is needed—never chase after a rally.
This week, for the first time, we will introduce a Chan Theory analysis system to systematically decompose the daily-level structure of BTC and HYPE. We will focus on tracking the end nodes of the BTC (6–7) upward segment and the HYPE (16–17) upward segment, and, together with support and resistance levels, provide mid- and short-term trading plan(s).
This week’s core viewpoint summary:
• Analysis of BTC’s daily-level price-action structure (see Part 1 for details)
• BTC this week: outlook and medium- to short-term trading strategy (see Part 2 for details)
• HYPE daily-level price-action structure analysis (see Part 3 for details)
• HYPE this week: outlook and short-term trading strategy (see Part 4 for details)
Last week’s trading strategy validation:
• Effectiveness of BTC short-term trades: Last week, based on the plan, we completed one short-term long trade (1x leverage). We successfully achieved a return of about 4.76%. (See Part 5 for details.)
1. Analysis of Bitcoin’s daily-level price-action structure
In the previous issue’s weekly review, this column was based on a moving-average analysis framework and clearly defined the price-action structure after BTC recorded this round’s rebound high at $82,300 on Sep 3 (this rebound began from July 1). In the short term, the price maintained a high-level box-like consolidation. The box’s upper boundary is around $82,850, while the lower boundary is near $75,500; meanwhile, a second daily-level upward central node was formed. Combined with the key time window of the Sep 17 Federal Reserve interest-rate decision, the previous weekly review laid out two potential evolution paths for last week’s走势 and, accordingly, formulated corresponding short-term trading plan(s). Based on validation from the actual price action: last week’s lowest price probed near $74,950, and the highest price touched around $81,950—highly consistent with Path 2 (for details of the projection, see the Sep 14 weekly review).
This week, we will introduce a Chan Theory analysis framework to further break down and forecast the current daily price-action structure.
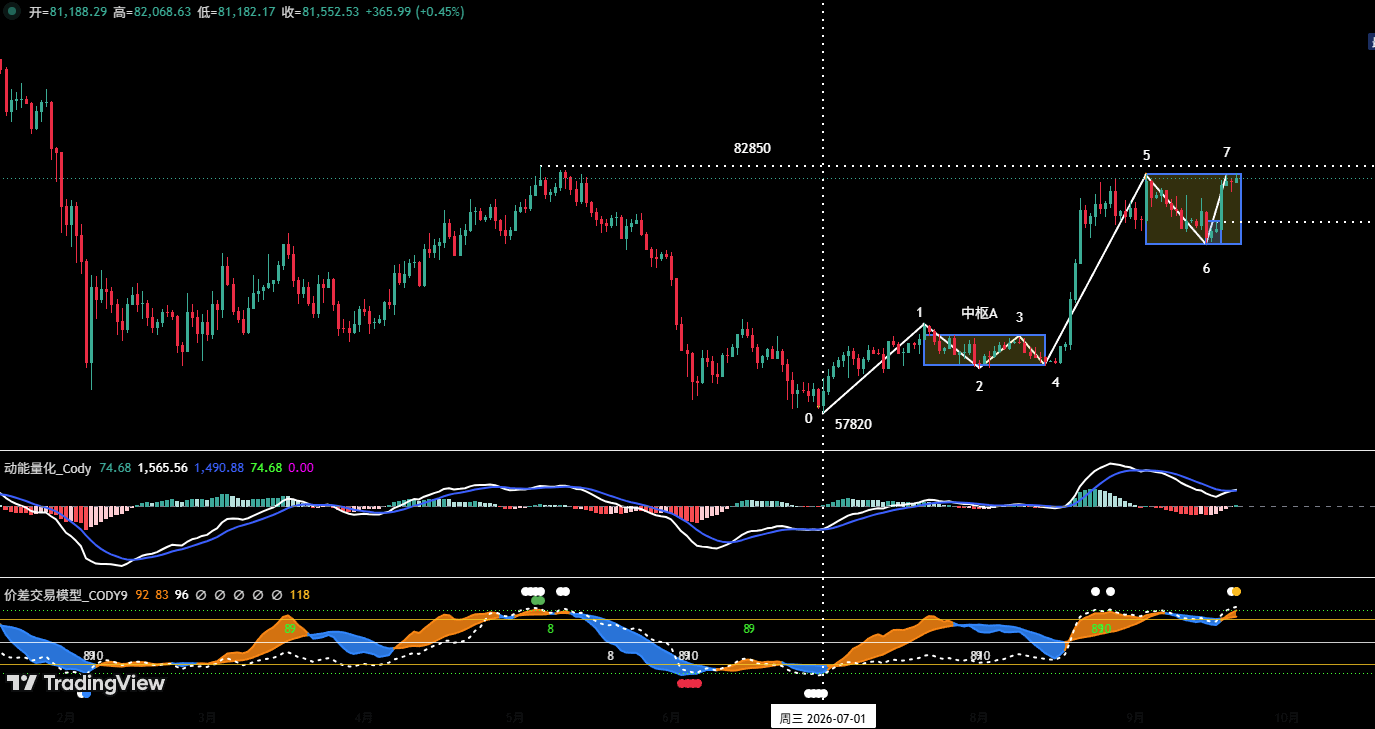
Figure 1: Bitcoin daily candlestick chart
1) Overall framework
As shown in (Figure 1): Since the rebound from the July 1 low, BTC has clearly formed a seven-segment upward structure from (0–1) to (6–7). It is currently in the process of constructing the upward segment (6–7).
2. Structural analysis based on Central Node A:
Based on the overlap of three segments—(1–2), (2–3), and (3–4)—the first daily-level upward central node (Central Node A) has been formed. Here, (0–1) is the central-node entry segment, and (4–5) is the central-node exit segment. Comparing the strength of the upward move between the entry and exit segments, the exit segment is clearly stronger than the entry segment. Therefore, after the exit segment ends, the probability of constructing the second upward central node starting from “Endpoint 5” is very high.
3. Daily-level: Maintain high-level consolidation to build up the second potential upward central node
Since “Endpoint 5,” the market has already moved through a downward segment (5–6), and is currently building the upward segment (6–7). As of now, this segment has approached the upper boundary of the box at $82,850. The price has experienced a period of consecutive short-term gains, and multiple technical indicators are in the overbought zone. Our “spread trading model” has triggered a top-warning signal (yellow/white dots); meanwhile, the “momentum quantification model” is in a top-dulling state (this state is a prerequisite condition for constructing a momentum bearish divergence at the top). Therefore, the current location is not suitable for chasing higher; be alert to the risk of short-term pullbacks, and watch for a potential downward segment that may form concurrently.
2. Bitcoin this week: outlook and trading strategy
1. BTC this week: outlook for price action
This week’s key viewpoint: Focus on the end node of the upward segment (6–7), and simultaneously track the construction of any subsequent potential downward segment.
2. Core resistance levels
• First resistance zone: around $82,850 (a previously important level)
• Second resistance zone: $84,500–$86,500 (a previously important resistance zone)
• Third resistance zone: the $90,000 area (a key round-number level)
3. Core support levels
• First support: the $79,500–$80,500 range (a previously important support)
• Second support: the $73,500–$75,000 range (a previously important support)
• Third support: the $67,300–$69,100 range (a previously important support)
4. This week’s trading strategy (excluding the impact of unexpected news)
① Medium-term strategy:
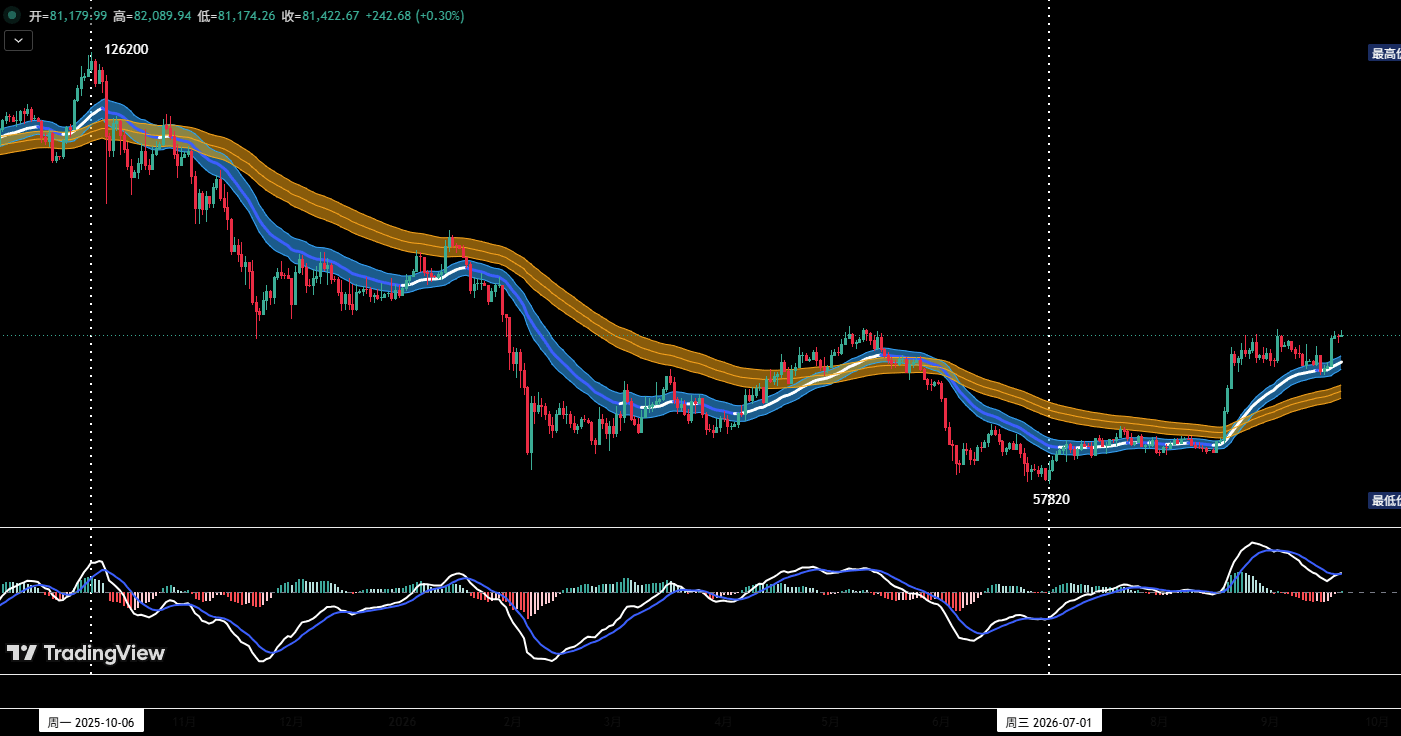
Figure 2: Bitcoin _ daily candlestick chart (position monitoring model)
Position monitoring model: As shown in (Figure 2), the price has broken out of the “long/short channel,” but has not yet reached the pullback-confirmation stage. Therefore, the current medium-term strategy is mainly to stay on the sidelines and observe with no position.
② Short-term strategy: Use a 30% position size, set stop-loss points, and, based on support and resistance levels, look for “spread” opportunities. (Use a 30-minute/60-minute chart as the trading cycle.)
③ During short-term trading, to dynamically adapt to the market’s complex evolution, we prepared two A/B sets of trading plan in advance.
• Plan A: Test a short position with a small allocation in the strong resistance zone.
• Opening a position: If the price rises into the $82,850–$84,500 range and forms a clear bearish rejection pattern, and the quantitative model simultaneously issues a top signal, then a short position of about 30% can be established.
• Risk control: set the initial stop-loss level.
• Take profit/close: When the adjustment brings price near an important support level and aligns with model signals, you can gradually close the position to secure gains.
• Plan B: Test a long position with a small allocation in the strong support zone.
• Opening a position: If the price pulls back to the key support level(s) above and forms a clear stabilization pattern, while the quantitative model simultaneously issues a bottom signal, then a long position of around 30% can be established.
• Risk control: set the initial stop-loss level.
• Close the position: When the rebound reaches near an important resistance level and matches the model signals, you can gradually close to take profits.
3. Analysis of HYPE’s daily-level price-action structure
In last issue’s weekly review, we introduced a Chan Theory analysis framework to dissect and judge the upward segment (14–15) on the 4-hour chart: the daily-level uptrend that began from “Endpoint 14” (the Aug 2 low of $51.11) was confirmed to have ended at “Endpoint 15” (the Sep 6 high of $89.76), and from that we predicted that an adjustment would follow. The actual prior-week走势 showed: the downward segment at the daily level (15–16). Price adjusted from the $89.76 high down to the $75.10 low, with a maximum drawdown of 16.33%. Our earlier analytical conclusion was fully validated by the market.
This week, we will analyze the structure of the current price action from a daily-chart level.
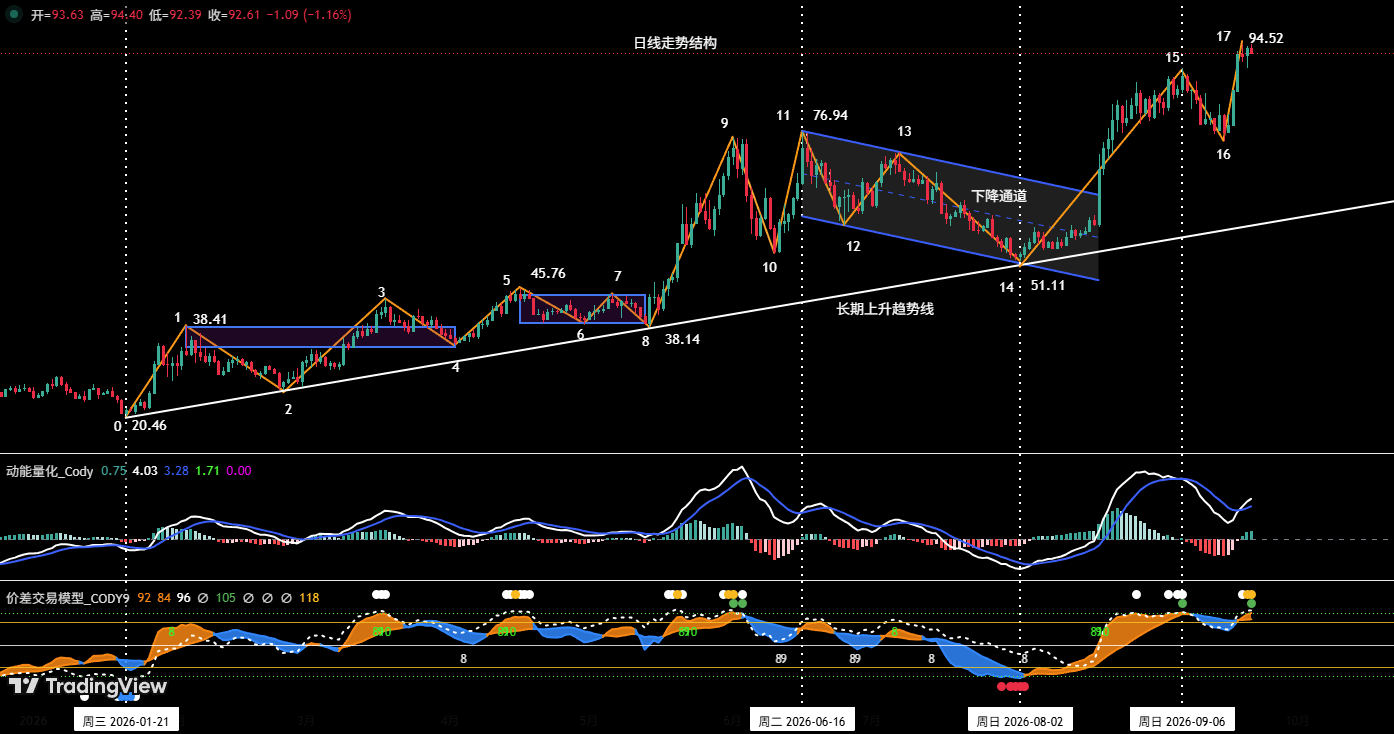
Figure 3: HYPE daily candlestick chart
1) Uptrend continuation
As shown in (Figure 3): After HYPE bottomed and stabilized near “Low 16” (the Sep 15 low of $75.18), it started the daily (16–17) upward segment. This segment had already set a historical new high of $94.52 on Sep 19, and the upward structure has not yet been confirmed to have ended. With the new high appearing, it confirms that the current uptrend that started from the Jan 21 low at $20.46 is still ongoing.
2. After making a new high, indicators enter a deep overbought range
As shown in (Figure 3), near the high of $94.52, our self-built “spread trading model” has continuously triggered top-warning signals (yellow/white dots + green dots). At the same time, the “momentum quantification model” has entered a top-dulling state. Therefore, the current price is already in a deep overbought range, and the upside space is limited. On execution, do not chase the rally, and remain alert to the risk of a high-level adjustment.
3. Outlook after the end of the upward segment
After the upward segment (16–17) is confirmed to have ended, the market may shift into a high-range consolidation pattern. If, during the pullback, the price effectively breaks below the key support around $90, then the next downside may probe the support around $85, and even potentially seek support again near $77.
4. HYPE this week: outlook and short-term trading strategy
1. HYPE this week: outlook for price action
① Core resistance level:
• First resistance level: around $100
② Core support levels:
• First support: around $90;
• Second support: the $84–$85 range;
• Third support: the $76–$77 range;
③ This week’s key viewpoint: Focus on where the rebound segment (16–17) ends, and also the likely strength of subsequent adjustments.
2. HYPE this week: short-term trading strategy
Stop the selloff at key support, and test a long position with a small allocation.
If price rises and meets resistance, it starts to pull back. When the adjustment reaches the key support level(s) above and shows signals of halting the decline and stabilizing, and the quantitative model simultaneously issues a bottom-buy signal, a small-allocation long test can be considered.
5. Short-term Bitcoin trade review
We strictly followed the trading plan. Based on the trade signals generated by our self-built “spread trading model” and “momentum quantification model,” we completed one short-term (long) trade last week, with total trading profits of about 4.76%.
1. Short-term trading records: (see Table 1)
Summary of Bitcoin short-term trade details: (Leverage *1x)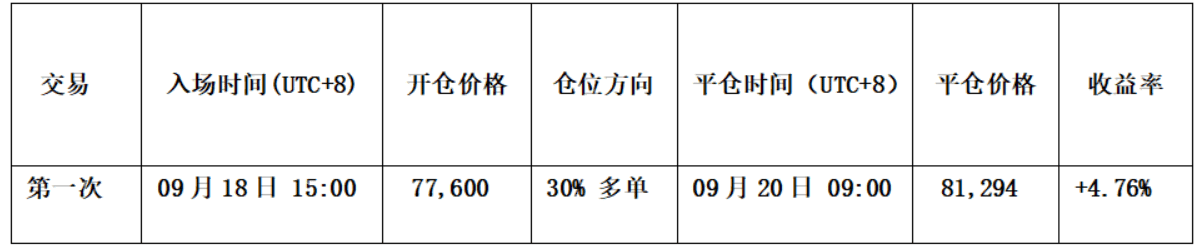
Table 1
2. Short-term trading review: (see Figure 4)
Position opening strategy:
① Around the time before and after the Federal Reserve interest-rate decision was released, the coin price maintained a range-bound fluctuation between $74,950 and $77,346. After the news was digested for a short period, the market strongly broke above the box’s upper boundary and continued its upward move.
② At the same time, the “momentum quantification model” formed a golden cross with the double-signal lines in the long position zone, and the “spread trading model” simultaneously issued a long signal.
Based on the multi-factor convergence mentioned above, establish a 30% long position at $77,600.
Closing strategy:
① When the price moves up to around $82,850, it shows a sluggish rise and the candlesticks form a “top reversal/peak pattern” (top-pattern formation).
② The “spread trading model” continuously released top-warning signals (yellow/white dots + green dots). Then the signal band (blue) crossed below the horizon line (green), and it also formed a top resonance with the “momentum quantification model.”
Based on the top-resonance signals above, we fully closed the position and liquidated all at $81,294.
Summary: This trade achieved a profit of about 4.76%.
3. Illustration of short-term trading
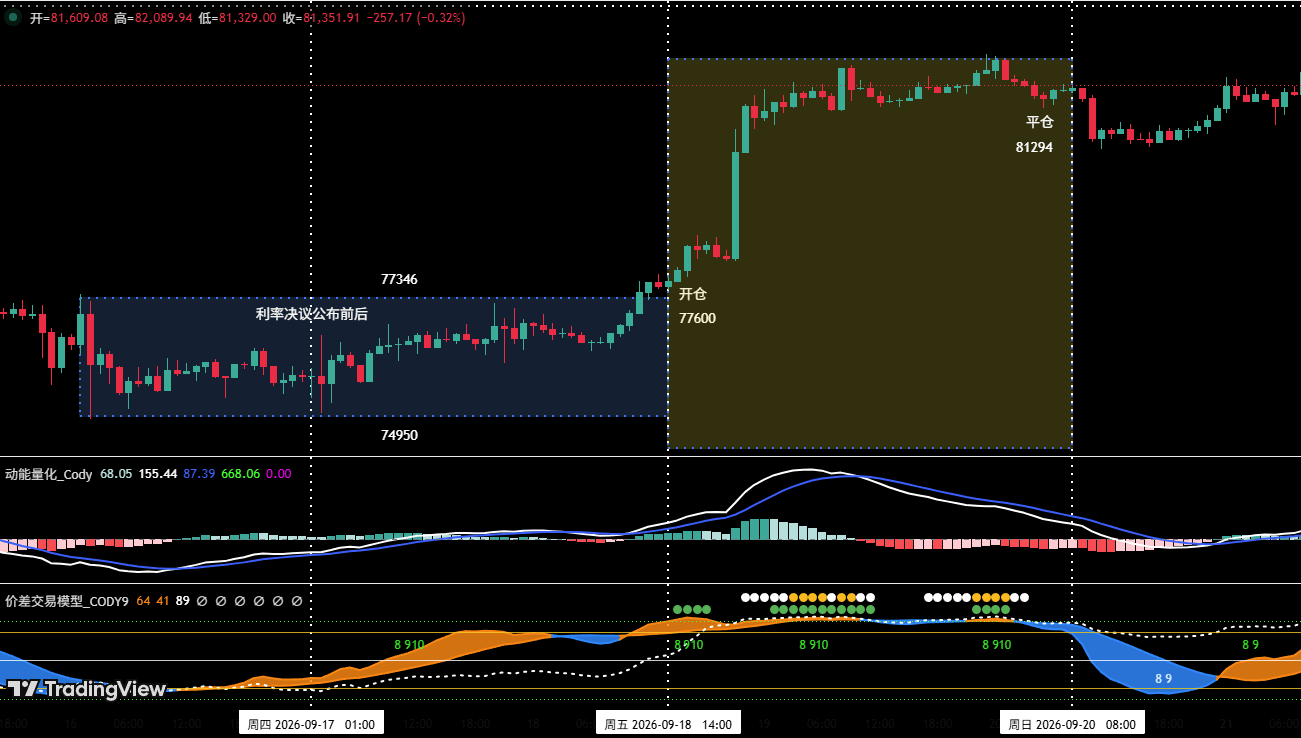
Figure 4: BTC _ 60-minute candlestick chart (momentum quantification model + spread trading model)
6. Special notice
1. When opening a position: immediately set the initial stop-loss level.
2. When profit reaches 1%: move the stop-loss to the opening cost price (breakeven point) to ensure the principal is safe.
3. When profit reaches 2%: move the stop-loss to the level where profit is 1%.
4. Ongoing tracking: Thereafter, for every additional 1% profit the coin price earns, the stop-loss level moves up by 1% as well. This provides dynamic protection and locks in gains.
Financial markets change rapidly, so all market analysis and trading strategies must be dynamically adjusted. All viewpoints, analysis models, and trading strategies discussed in this article originate from my personal technical analysis only, and are for my own trading journal purposes only. They do not constitute investment advice or a basis for any trading decisions. There are risks in the market; invest cautiously. Please do not make decisions based solely on this.