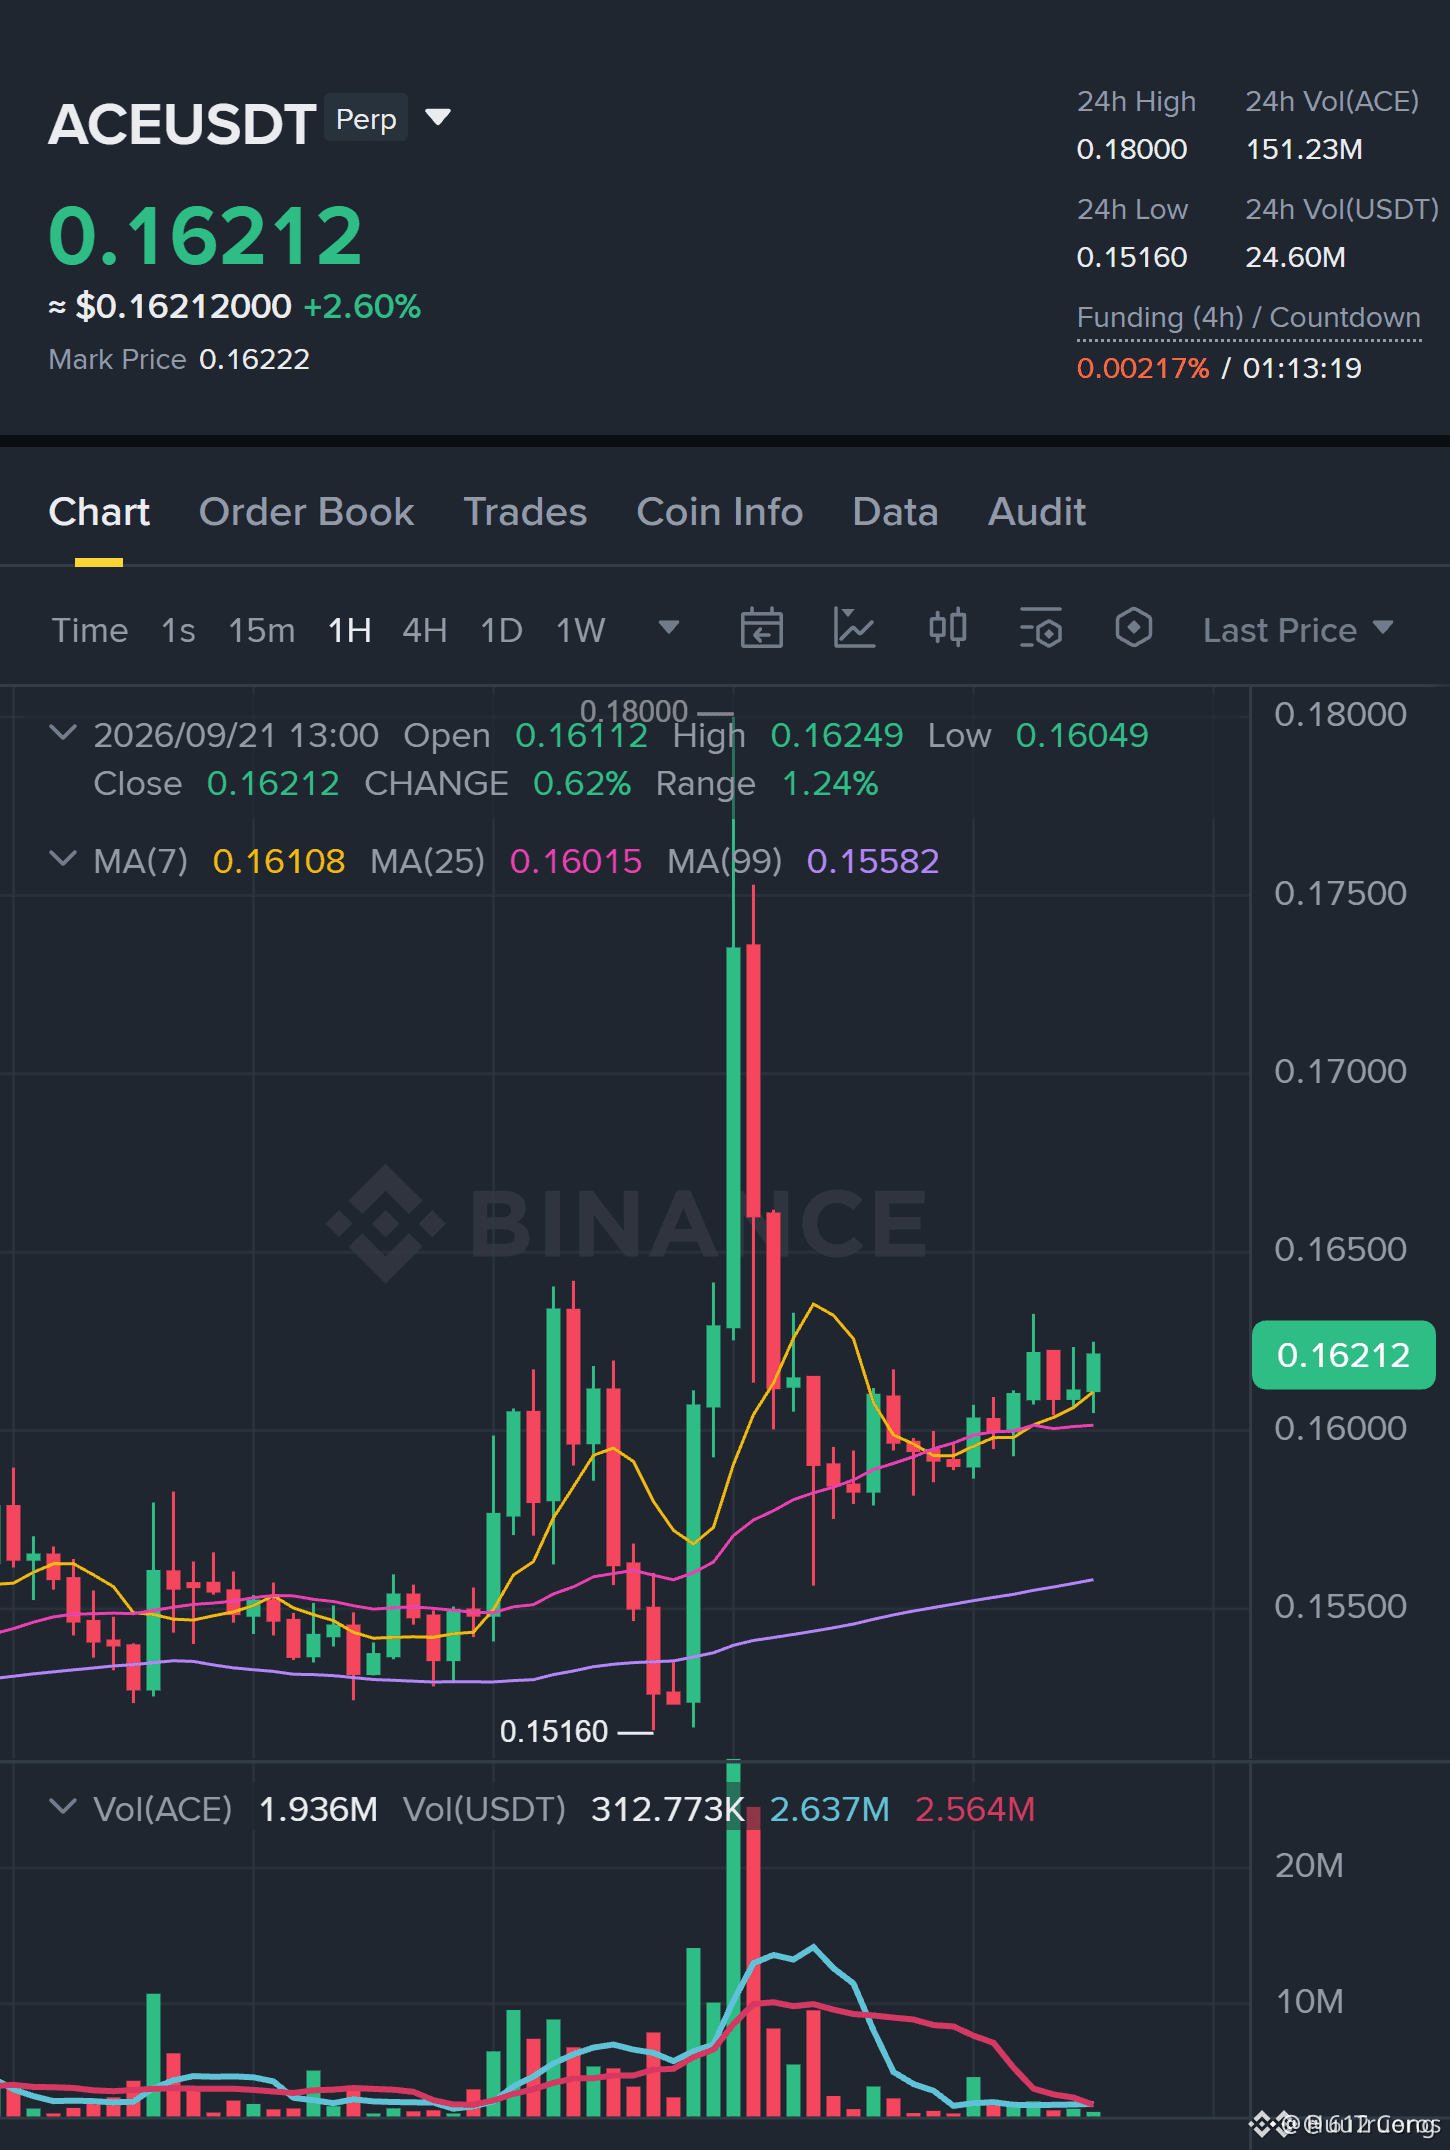
ACE price holds above its stacked EMA lines on the daily and 1h timeframes.
🟢 $ACE /USDT | Trend: LONG (tilting) | 5/12 signals aligned
⚠️ Just a slight tilt: 7/12 signals are still uncertain. Keep position size small.
ACE setup checklist: 5/12 signals aligned
🟢 Daily trend: price > EMA50 > EMA200, EMA stack rising
🟢 1h trend: price > EMA50 > EMA200, EMA stack rising
🟢 4h RSI: 57.1, momentum increasing (above 55)
🟢 Short-term momentum (15m): RSI z-score +1.19, latest candle +0.17%, buyers are applying pressure
🟢 Relative strength vs BTC: outperformance, +2.36% vs BTC over the past 1 day
🟠 Invalidated: wrong thesis if it exceeds 0.154200
Overview: The daily trend is the strongest supporting factor, with a clearly bullish structure above EMA50 and EMA200. The 1h trend reflects this with a similar EMA stack, and the short-term momentum is also supportive thanks to the rising RSI z-score and a positive last candle. The main counter-factor is the 4h trend being mixed: price is still above EMA50, but the EMAs aren’t stacked yet, which makes the confidence level moderate.
Price map:
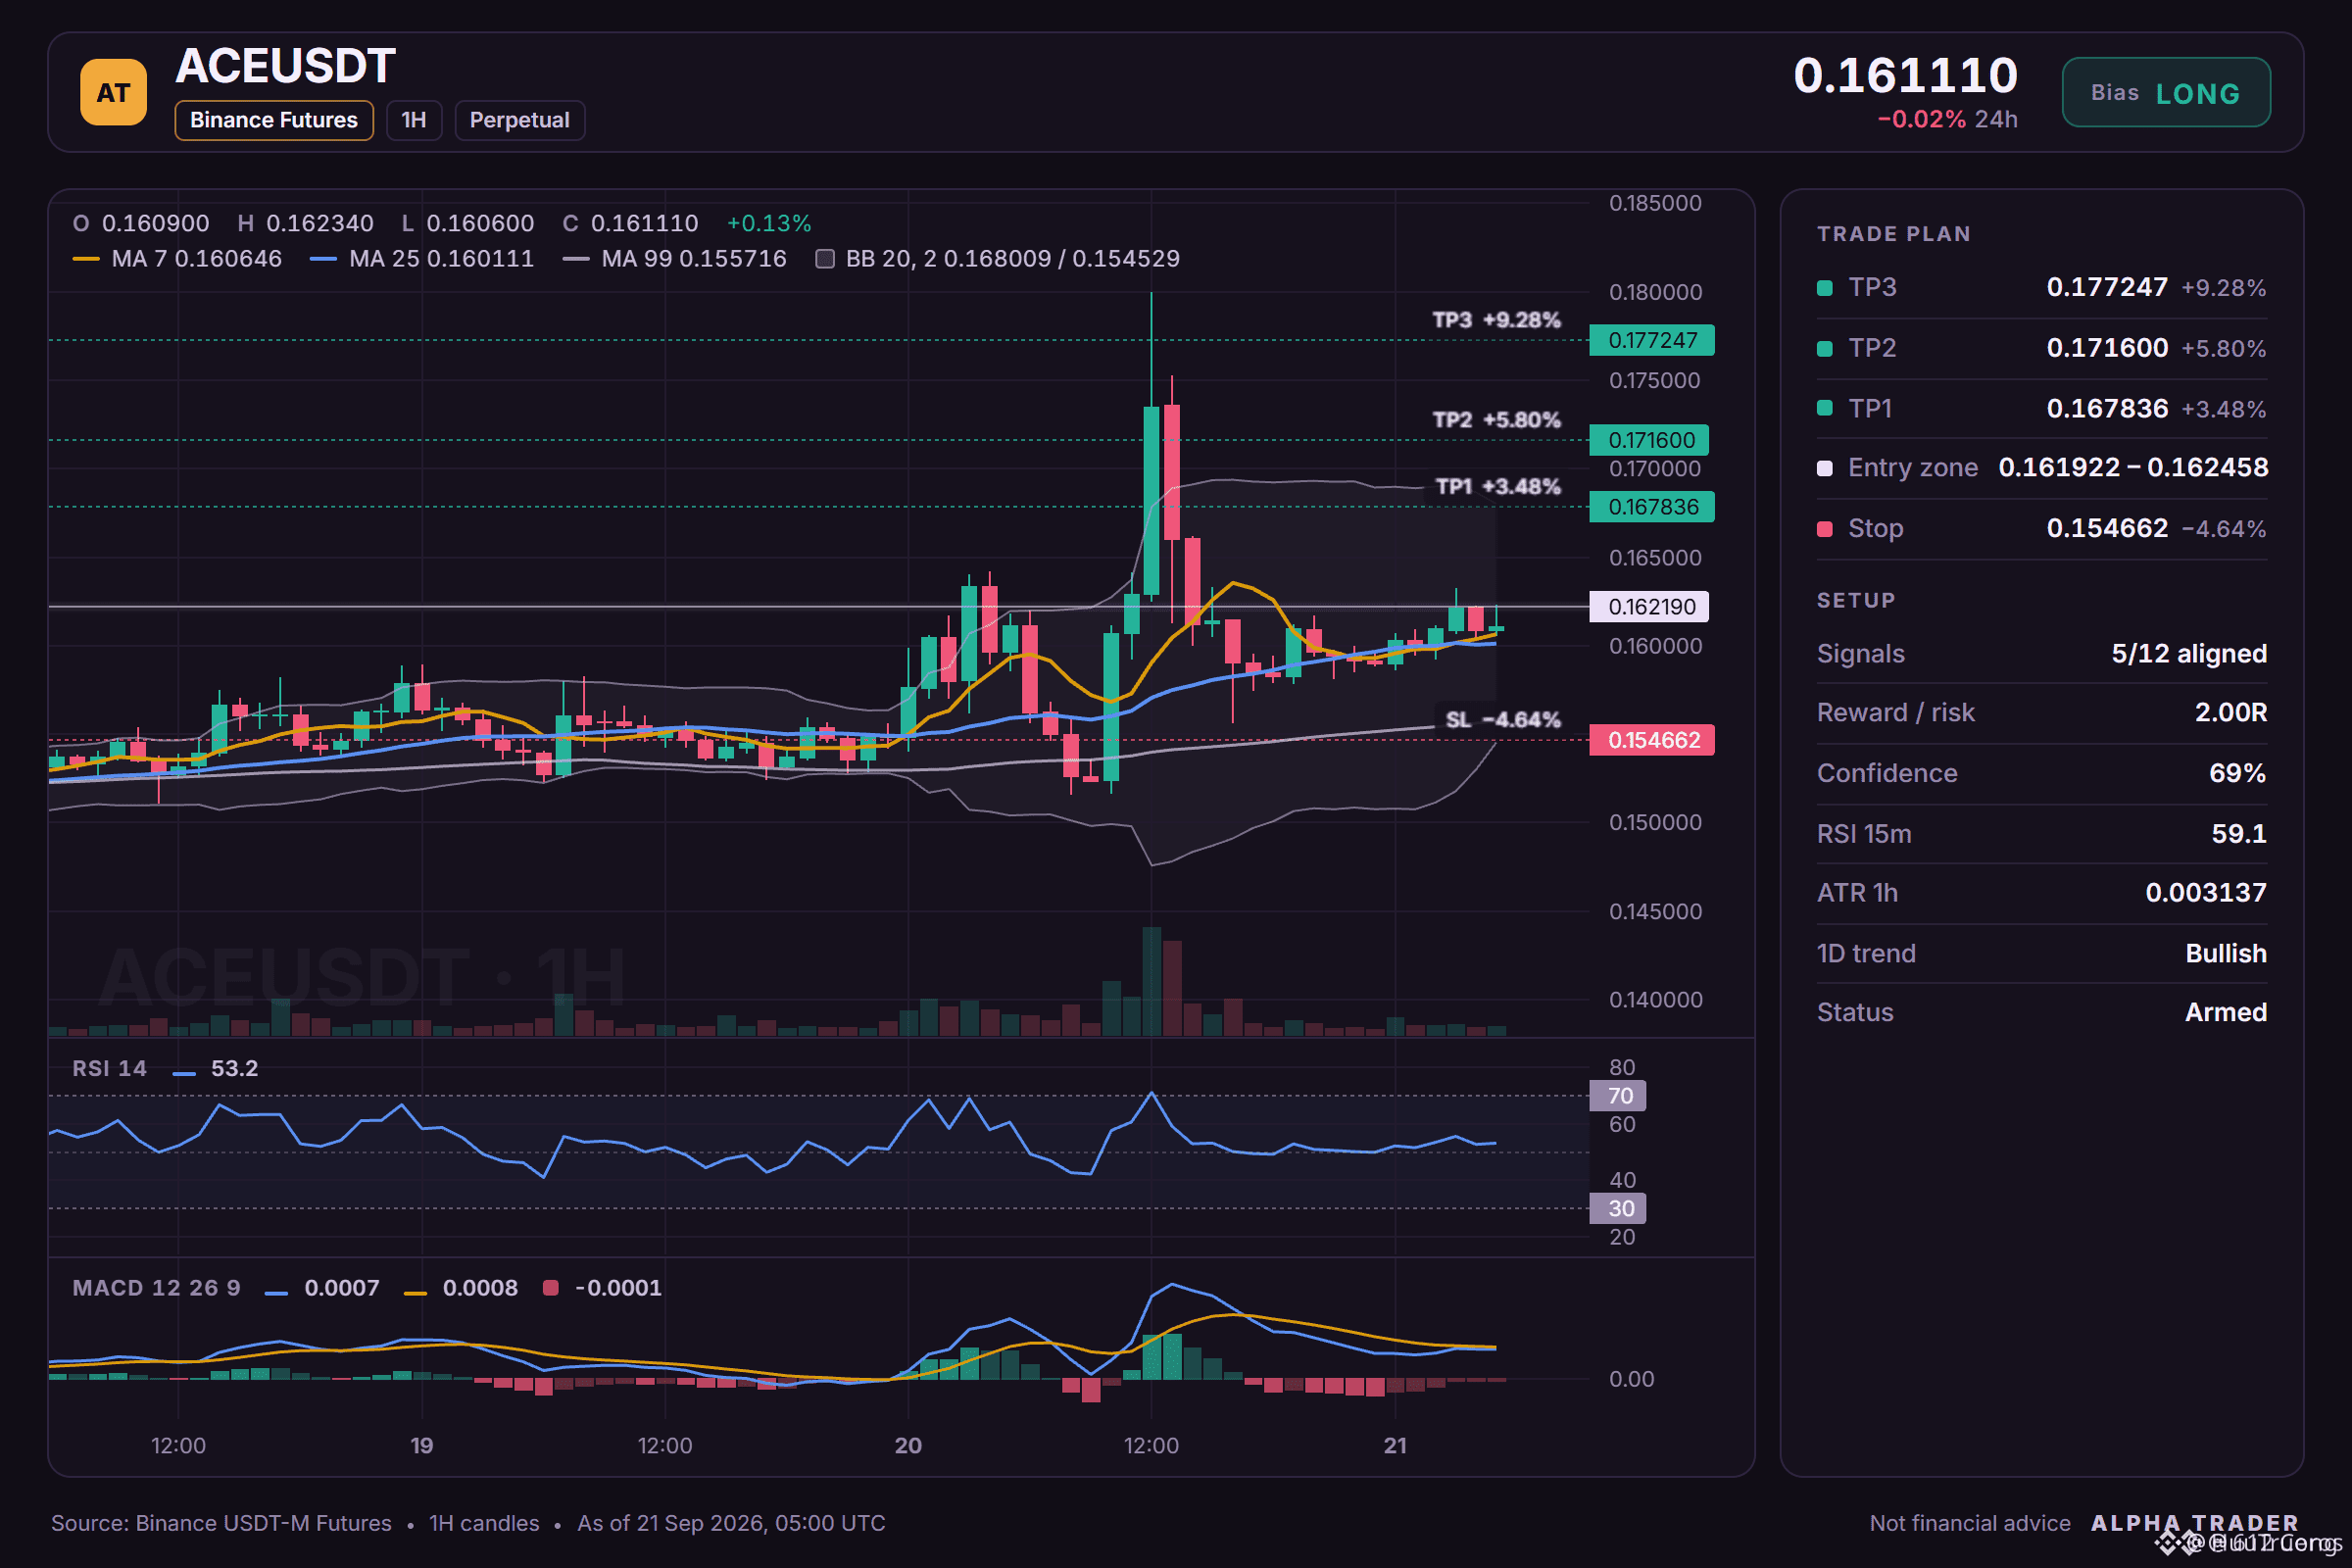
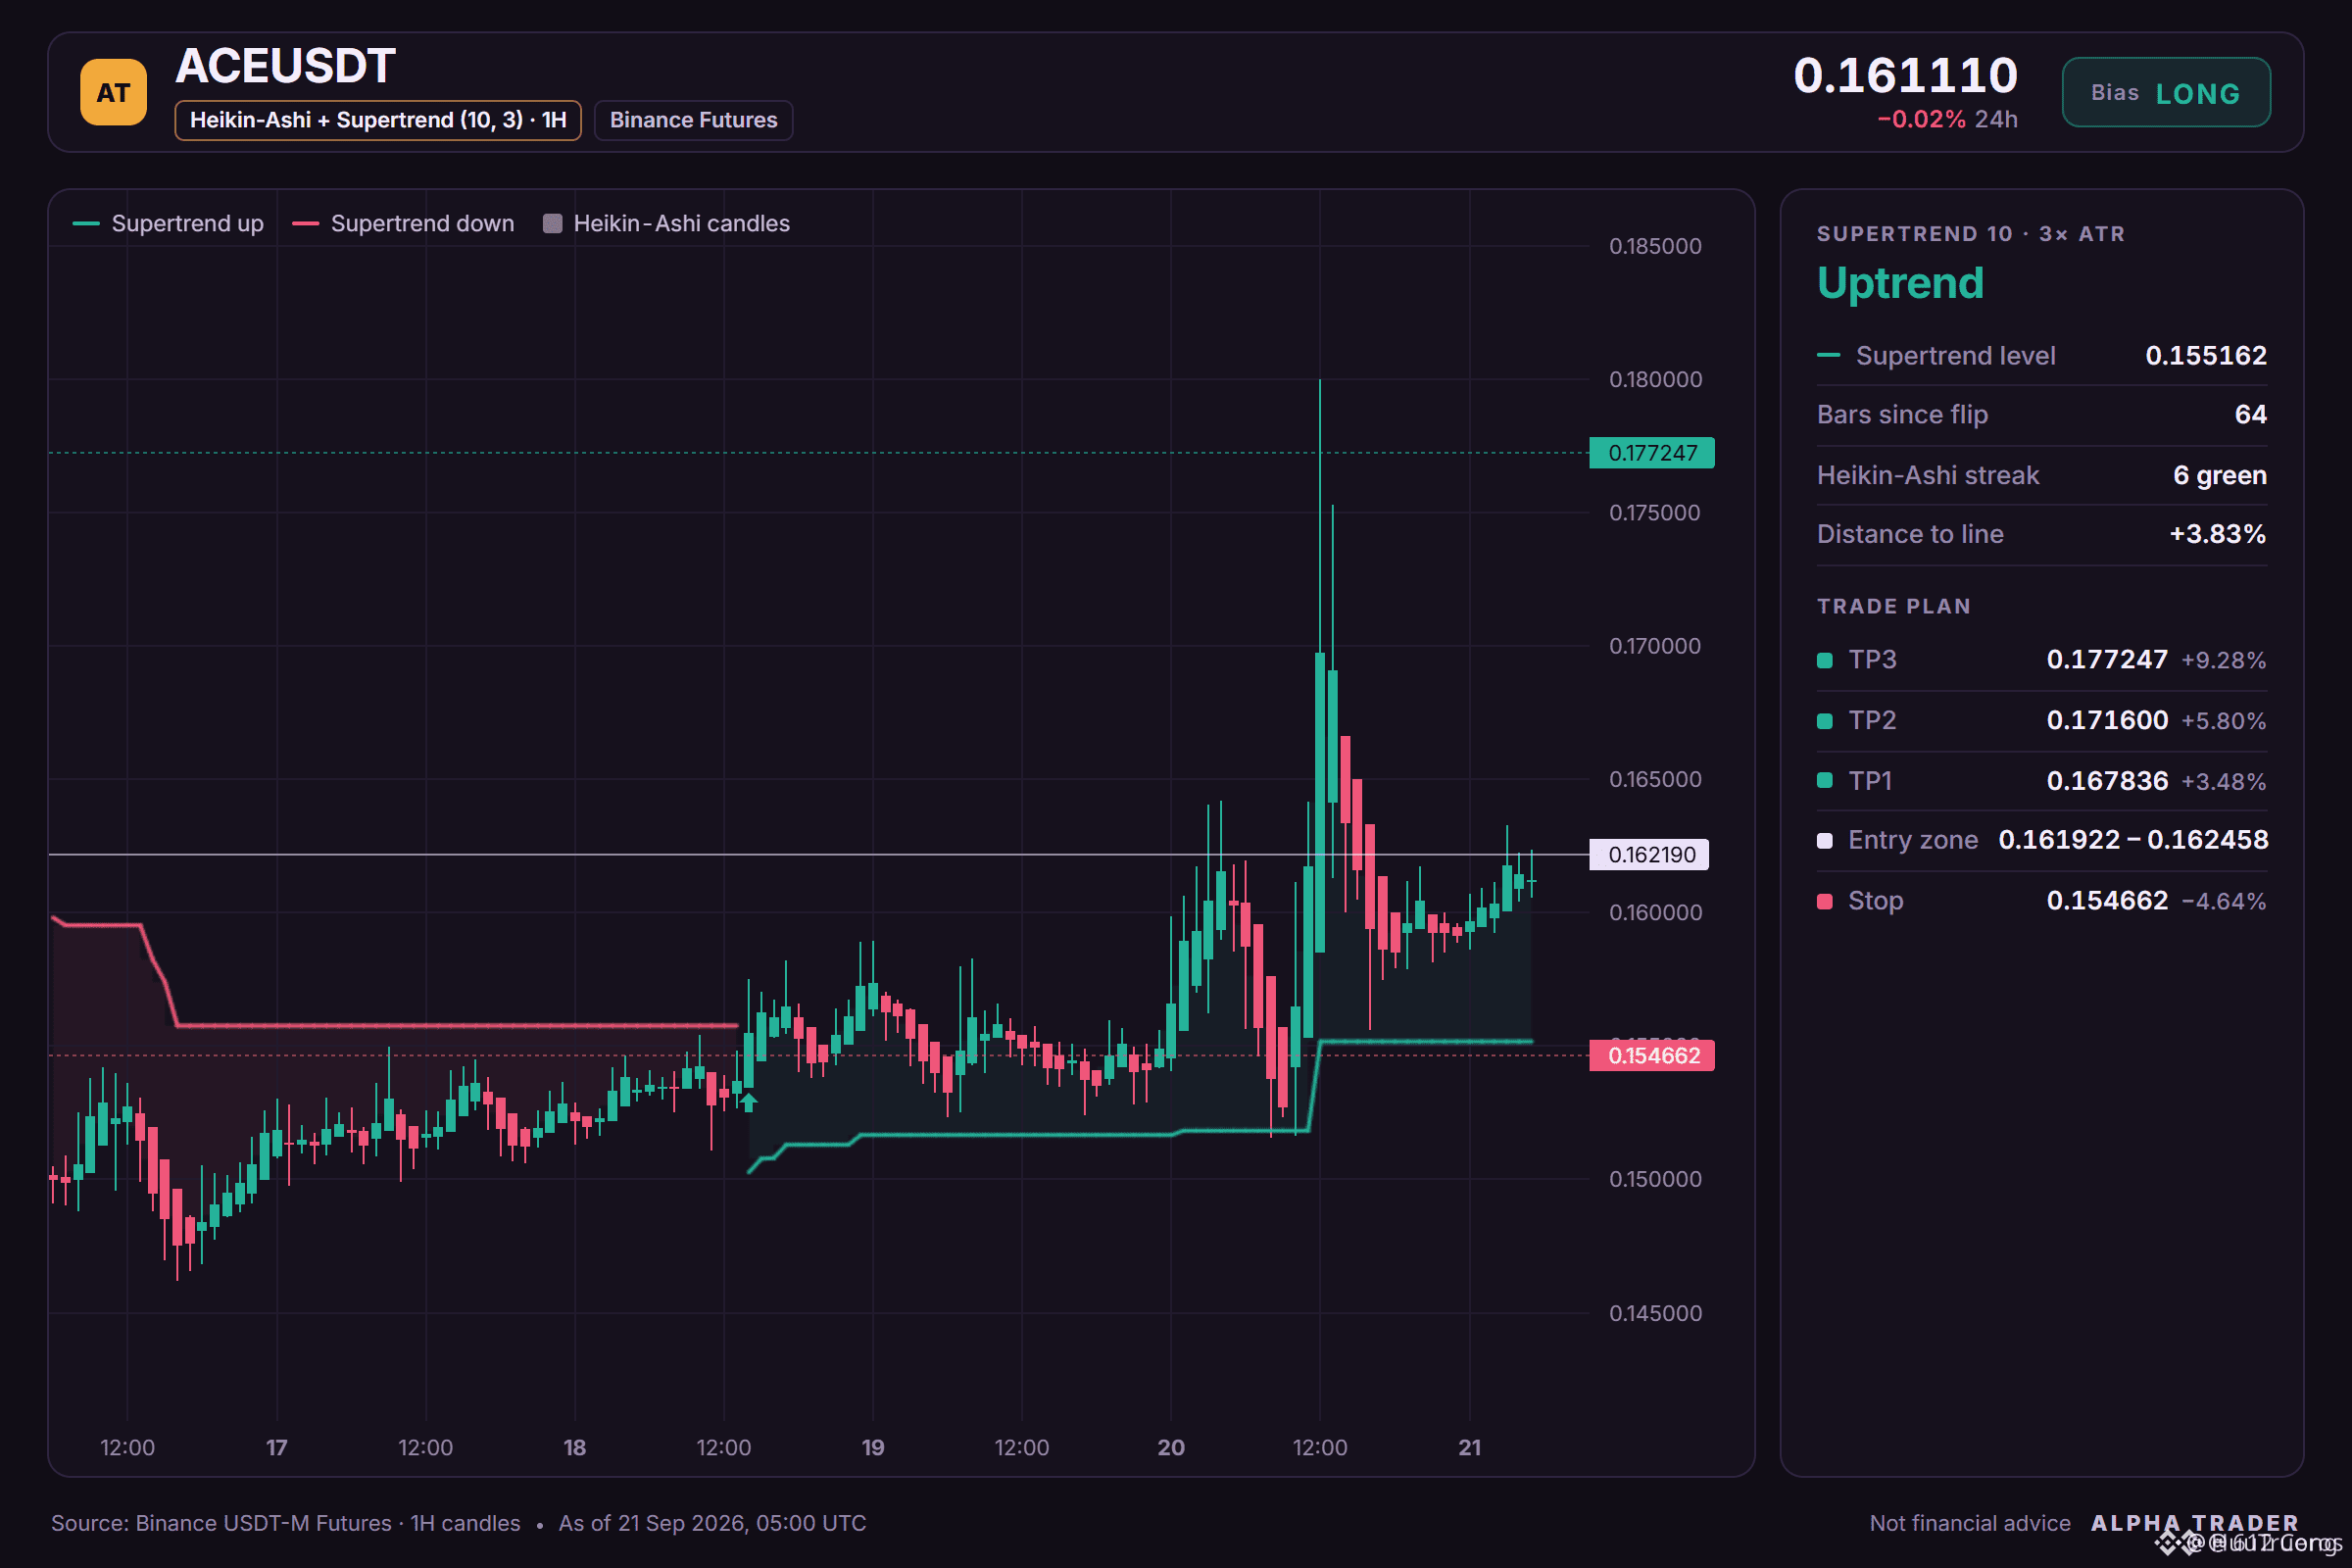
🎯 TP3: 0.177247
🎯 TP2: 0.171600
🎯 TP1: 0.167836
📍 Entry: 0.161922 – 0.162458
🛑 SL: 0.154662
If you LONG from the reference zone into the trade, where would you place your SL?
Chart with all levels 👇
⚠️ Personal market analysis only. NFA — manage risk and DYOR.
Educational content only, not investment advice or a recommendation to buy, sell, deposit, or withdraw any asset. No paid advertisements/promotions or referral/affiliate links.
🟢 $ACE /USDT | Trend: LONG (tilting) | 5/12 signals aligned
⚠️ Just a slight tilt: 7/12 signals are still uncertain. Keep position size small.
ACE setup checklist: 5/12 signals aligned
🟢 Daily trend: price > EMA50 > EMA200, EMA stack rising
🟢 1h trend: price > EMA50 > EMA200, EMA stack rising
🟢 4h RSI: 57.1, momentum increasing (above 55)
🟢 Short-term momentum (15m): RSI z-score +1.19, latest candle +0.17%, buyers are applying pressure
🟢 Relative strength vs BTC: outperformance, +2.36% vs BTC over the past 1 day
🟠 Invalidated: wrong thesis if it exceeds 0.154200
Overview: The daily trend is the strongest supporting factor, with a clearly bullish structure above EMA50 and EMA200. The 1h trend reflects this with a similar EMA stack, and the short-term momentum is also supportive thanks to the rising RSI z-score and a positive last candle. The main counter-factor is the 4h trend being mixed: price is still above EMA50, but the EMAs aren’t stacked yet, which makes the confidence level moderate.
Price map:
🎯 TP3: 0.177247
🎯 TP2: 0.171600
🎯 TP1: 0.167836
📍 Entry: 0.161922 – 0.162458
🛑 SL: 0.154662
If you LONG from the reference zone into the trade, where would you place your SL?
Chart with all levels 👇
⚠️ Personal market analysis only. NFA — manage risk and DYOR.
Educational content only, not investment advice or a recommendation to buy, sell, deposit, or withdraw any asset. No paid advertisements/promotions or referral/affiliate links.