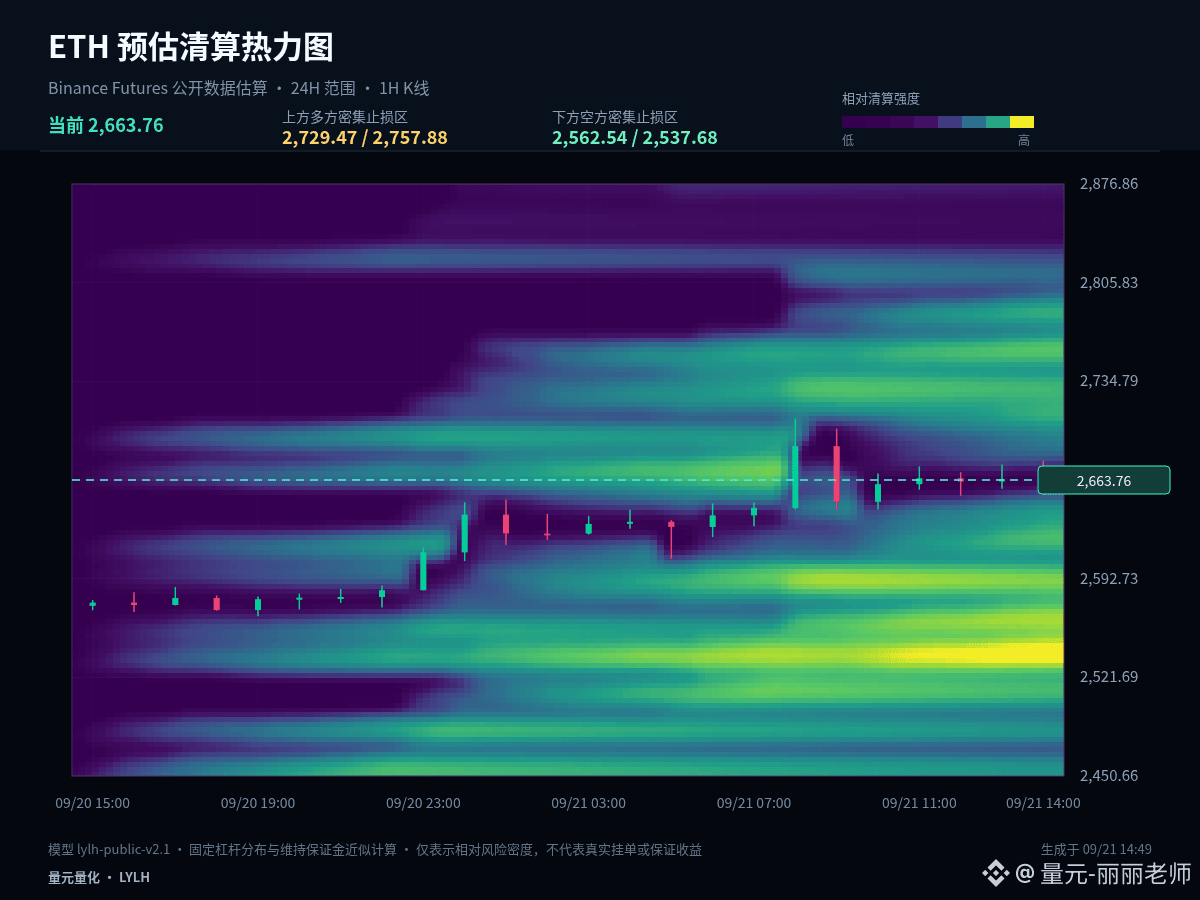
$ETH #ETH Current price is 2,666. This time I’m not just looking at the rise/fall percentage. I’ve overlaid the 1-hour structure with the estimated liquidation distribution to observe which side the price is more likely to seek liquidity next.
In the current 1-hour window: +0.02%, and over 24 hours: +3.52%. Across these two periods, there isn’t enough clearly directional alignment. In a range market, the tolerance for chasing is lower. It’s better to use the upper boundary for directional confirmation and the lower boundary for holding/acceptance confirmation. The middle axis is only used as the line separating strength and weakness.
In the estimated liquidation distribution, the dense long-side stop-loss area above is concentrated around 2,729.47, while the dense short-side stop-loss area below is concentrated around 2,562.54. The bright zones indicate where potential liquidity is more concentrated, and they don’t directly equal reversal points. What matters is the speed after price touches them, how long it stays, and whether price can reclaim—those are what indicate the reaction of capital.
From the price structure: 2,637.61 is the intraday mid-axis. Conventional resistance and support are at 2,707.7 and 2,567.52, respectively. Use heatmap price levels to watch for potential liquidity, and use key candle levels to confirm the structure. When they overlap, the reference value is higher. When they don’t, you should rely on the actual price reaction.
For the next path, there are three ways to handle it: if price holds effectively above 2,707.7, wait for a pullback that doesn’t break and then reassess for continuation; if price breaks below 2,567.52, prioritize risk control and wait for new support; if price continues to oscillate around 2,637.61, treat it as rotation within the range—don’t repeatedly chase direction from the middle.
Risk control still comes before any conclusion: only act when the conditions appear, and if the price becomes invalid, reassess promptly. The higher the volatility, the more restrained you should be with single-position sizing. The above is a market projection based on current 1-hour and 24-hour data, and it does not constitute any promise of returns.
If the next 1-hour candle closes above 2,637.61, the structure will be more proactive. If it closes below, then remain cautious. Which of these paths are you leaning toward right now?
#BOJRaisesRatesTo31YearHigh
In the current 1-hour window: +0.02%, and over 24 hours: +3.52%. Across these two periods, there isn’t enough clearly directional alignment. In a range market, the tolerance for chasing is lower. It’s better to use the upper boundary for directional confirmation and the lower boundary for holding/acceptance confirmation. The middle axis is only used as the line separating strength and weakness.
In the estimated liquidation distribution, the dense long-side stop-loss area above is concentrated around 2,729.47, while the dense short-side stop-loss area below is concentrated around 2,562.54. The bright zones indicate where potential liquidity is more concentrated, and they don’t directly equal reversal points. What matters is the speed after price touches them, how long it stays, and whether price can reclaim—those are what indicate the reaction of capital.
From the price structure: 2,637.61 is the intraday mid-axis. Conventional resistance and support are at 2,707.7 and 2,567.52, respectively. Use heatmap price levels to watch for potential liquidity, and use key candle levels to confirm the structure. When they overlap, the reference value is higher. When they don’t, you should rely on the actual price reaction.
For the next path, there are three ways to handle it: if price holds effectively above 2,707.7, wait for a pullback that doesn’t break and then reassess for continuation; if price breaks below 2,567.52, prioritize risk control and wait for new support; if price continues to oscillate around 2,637.61, treat it as rotation within the range—don’t repeatedly chase direction from the middle.
Risk control still comes before any conclusion: only act when the conditions appear, and if the price becomes invalid, reassess promptly. The higher the volatility, the more restrained you should be with single-position sizing. The above is a market projection based on current 1-hour and 24-hour data, and it does not constitute any promise of returns.
If the next 1-hour candle closes above 2,637.61, the structure will be more proactive. If it closes below, then remain cautious. Which of these paths are you leaning toward right now?
#BOJRaisesRatesTo31YearHigh