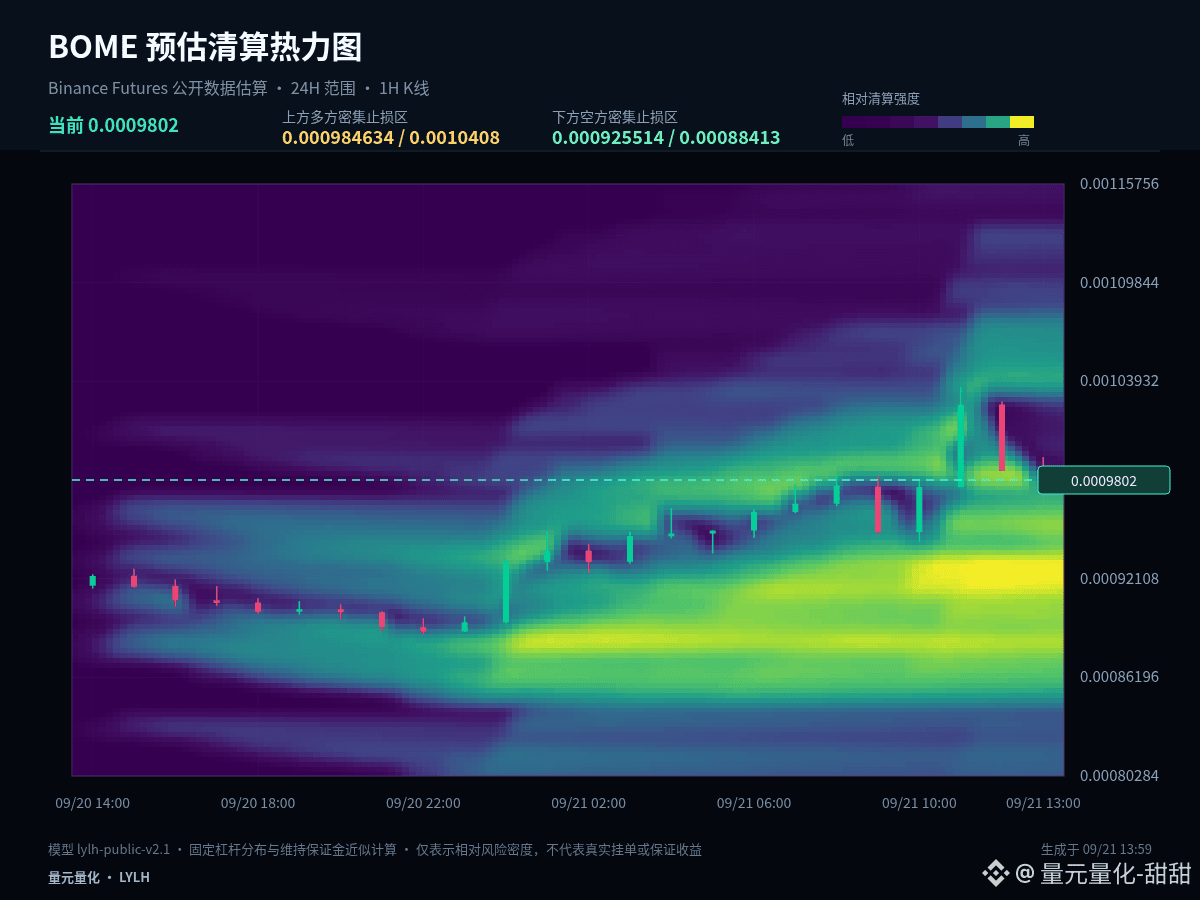
$BOME #BOME This time, I’ll break it down from a position perspective. With the same chart, the key points you notice differ depending on whether you already hold a position or are currently sidelined. Current price: 0.0009805; 1-hour: -0.69%; 24-hour: +6.84%.
Based on the alignment of timeframes, the 24-hour performance is still +6.84%, while the 1-hour has pulled back to -0.69%, which looks more like a cooling-off phase within an uptrend structure. If the retracement doesn’t break key support, it’s considered normal rotation. If support is lost and the rebound lacks strength, then short-term control shifts from bulls to bears.
For those already in positions, watch whether 0.0008896 is broken. If it breaks, first reduce risk exposure. For those on the sidelines, wait for the low to stop making lower lows, and confirm that price moves back above 0.00096245—don’t try to catch a falling structure too early.
My scenario analysis isn’t a one-way bet. A breakout above 0.0010353 and the ability to hold it reopens upside space. A breakdown below 0.0008896 without an adequate retest suggests further structural weakening. If price ranges between the two, keep observing how closes behave on both sides of 0.00096245.
For those holding positions, the focus is to manage based on whether support is invalidated—not to be carried along by every fluctuation. For those not in positions, prioritize waiting for breakout + retest or support confirmation. Spot can be scaled in batches; for futures, shorten the decision chain: first determine the stop-loss level, then decide whether to participate.
The key for contracts isn’t to predict every single K-line, but to ensure that entries, scaling down, and exits have a basis. If there’s no confirmation, do less. If key levels fail, redo the plan: control the risk of each trade first, then talk about the subsequent upside.
#VietnamPlansFirstCryptoLicensesIn2026
Based on the alignment of timeframes, the 24-hour performance is still +6.84%, while the 1-hour has pulled back to -0.69%, which looks more like a cooling-off phase within an uptrend structure. If the retracement doesn’t break key support, it’s considered normal rotation. If support is lost and the rebound lacks strength, then short-term control shifts from bulls to bears.
For those already in positions, watch whether 0.0008896 is broken. If it breaks, first reduce risk exposure. For those on the sidelines, wait for the low to stop making lower lows, and confirm that price moves back above 0.00096245—don’t try to catch a falling structure too early.
My scenario analysis isn’t a one-way bet. A breakout above 0.0010353 and the ability to hold it reopens upside space. A breakdown below 0.0008896 without an adequate retest suggests further structural weakening. If price ranges between the two, keep observing how closes behave on both sides of 0.00096245.
For those holding positions, the focus is to manage based on whether support is invalidated—not to be carried along by every fluctuation. For those not in positions, prioritize waiting for breakout + retest or support confirmation. Spot can be scaled in batches; for futures, shorten the decision chain: first determine the stop-loss level, then decide whether to participate.
The key for contracts isn’t to predict every single K-line, but to ensure that entries, scaling down, and exits have a basis. If there’s no confirmation, do less. If key levels fail, redo the plan: control the risk of each trade first, then talk about the subsequent upside.
#VietnamPlansFirstCryptoLicensesIn2026