ZETA: Explosive Markup Surges Past MA100 to Challenge Key $0.070 Ceiling – Breakout Long Targeting $0.100 Resistance Shelf
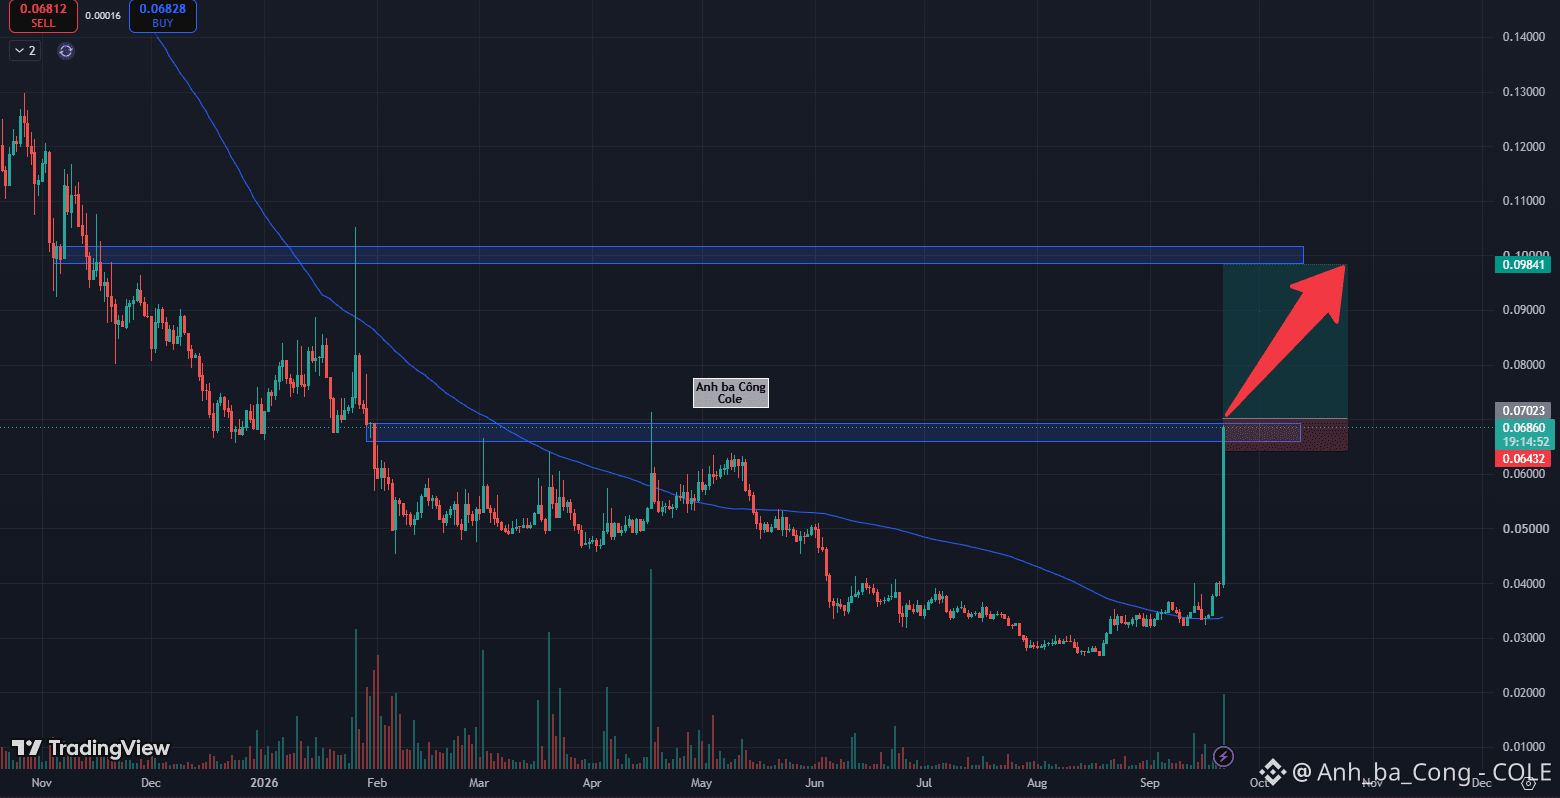
ZetaChain (ZETA) is displaying an aggressive return of institutional capital on the daily timeframe, marked by an expansive vertical green candle propelling price action upward. Crucially, this decisive impulse represents the first time in multiple months that price action has successfully broken out and traded far above the dynamic MA100 trendline.
Based on visual data from the daily chart , the active daily candle near the $0.068–$0.070 zone is directly testing a critical horizontal resistance shelf established back in January 2026. An unprecedented volume spike paired with strong candle expansion confirms that aggressive buy-side demand has thoroughly overwhelmed active sellers. This decisive participation indicates that major market participants have neutralized historical overhead distribution while systematically absorbing all remaining floating supply. Once a daily candle close confirms acceptance above the $0.070 barrier, this structural resistance will flip into an unyielding demand base, unlocking momentum for an extended continuation leg.
The most disciplined trading approach is to await a confirmed daily candle close decisively above $0.0702 before executing a trend Long. A tight protective stop-loss parameter should be positioned just beneath the converted breakout shelf at $0.0643. The primary strategic take-profit objective targets the next macro resistance band and psychological round-number level across the $0.0984–$0.1000 zone. Disclaimer: This is not financial advice, DYOR. $ZETA $NIL $SAGA #Colecolen
ZetaChain (ZETA) is displaying an aggressive return of institutional capital on the daily timeframe, marked by an expansive vertical green candle propelling price action upward. Crucially, this decisive impulse represents the first time in multiple months that price action has successfully broken out and traded far above the dynamic MA100 trendline.
Based on visual data from the daily chart , the active daily candle near the $0.068–$0.070 zone is directly testing a critical horizontal resistance shelf established back in January 2026. An unprecedented volume spike paired with strong candle expansion confirms that aggressive buy-side demand has thoroughly overwhelmed active sellers. This decisive participation indicates that major market participants have neutralized historical overhead distribution while systematically absorbing all remaining floating supply. Once a daily candle close confirms acceptance above the $0.070 barrier, this structural resistance will flip into an unyielding demand base, unlocking momentum for an extended continuation leg.
The most disciplined trading approach is to await a confirmed daily candle close decisively above $0.0702 before executing a trend Long. A tight protective stop-loss parameter should be positioned just beneath the converted breakout shelf at $0.0643. The primary strategic take-profit objective targets the next macro resistance band and psychological round-number level across the $0.0984–$0.1000 zone. Disclaimer: This is not financial advice, DYOR. $ZETA $NIL $SAGA #Colecolen