🚀 Bitcoin regains momentum: heading toward the key resistance! ⚡
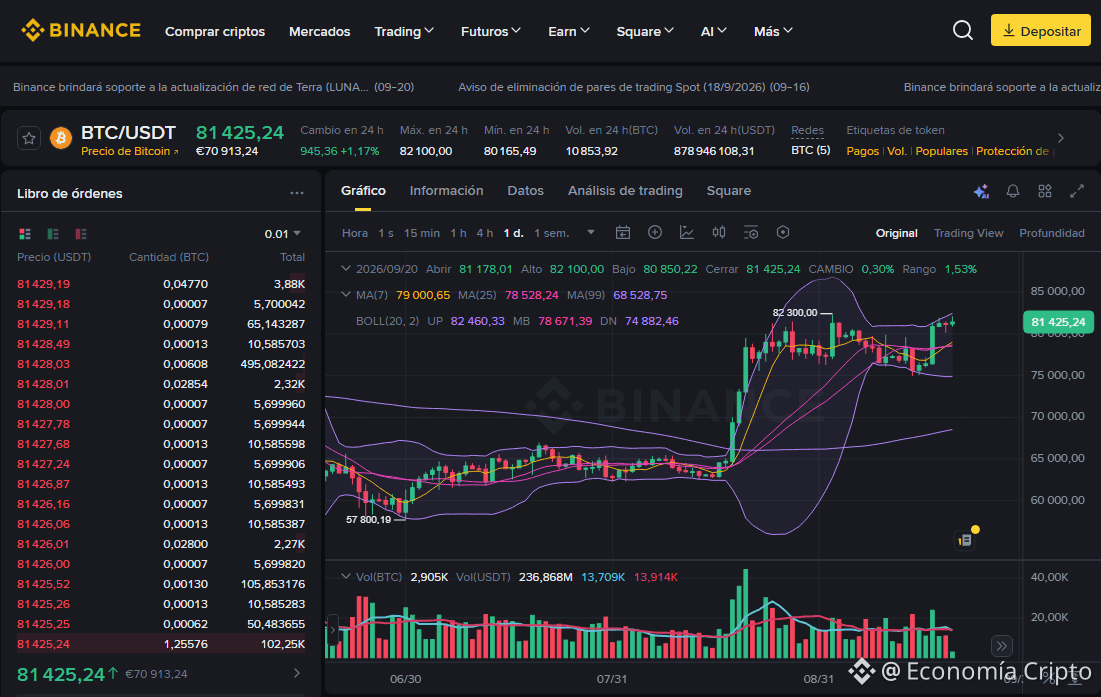
The BTC/USDT pair is trading at 81,425.24, recording a +1.17% gain over the last 24 hours. The daily session shows an opening at 81,178.01, a high of 82,100.00, a low of 80,850.22, and a close of 81,425.24 (+0.30%), reflecting a recovery in buying pressure in the market.
🔍 Trend Analysis and Indicators
Trend: Bullish in the short and medium term, consolidating a solid rebound after the recent technical pause.
Moving Averages: The price is clearly above the MA(7) (79,000.65) and the MA(25) (78,528.24), while the underlying structure remains firmly supported as it trades well above the MA(99) (68,528.75).
Bollinger Bands: Price rebounds from the middle band MB (78,671.39) and is pointing toward the upper band UP (82,460.33) (with the lower band DN (74,882.46)), indicating an increase in buying volatility.
Key Levels: Immediate support is consolidating around the 80,850 area, while the main resistance to overcome is located at the session highs at 82,100.
💡 Trading Strategy: Buy or Sell?
Buy (Long)?: Support holding and the price position above the fast moving averages support tactical entry opportunities to seek an upside extension toward the upper band, managing risk with an adjusted Stop Loss.
Sell (Short)?: Trading to the downside carries high risk due to the strong underlying bullish trend; it would only be considered in the event of a major rejection in the resistance zone.
#Bitcoin #AnalisisTecnico #CryptoTrading
May the Lord bless and prosper the one who operates here, in the name of Jesus, because your word says: "Mine is the silver, and mine is the gold, says the LORD of hosts." Hageo 2:8 RV1960-T -
$BTC
The BTC/USDT pair is trading at 81,425.24, recording a +1.17% gain over the last 24 hours. The daily session shows an opening at 81,178.01, a high of 82,100.00, a low of 80,850.22, and a close of 81,425.24 (+0.30%), reflecting a recovery in buying pressure in the market.
🔍 Trend Analysis and Indicators
Trend: Bullish in the short and medium term, consolidating a solid rebound after the recent technical pause.
Moving Averages: The price is clearly above the MA(7) (79,000.65) and the MA(25) (78,528.24), while the underlying structure remains firmly supported as it trades well above the MA(99) (68,528.75).
Bollinger Bands: Price rebounds from the middle band MB (78,671.39) and is pointing toward the upper band UP (82,460.33) (with the lower band DN (74,882.46)), indicating an increase in buying volatility.
Key Levels: Immediate support is consolidating around the 80,850 area, while the main resistance to overcome is located at the session highs at 82,100.
💡 Trading Strategy: Buy or Sell?
Buy (Long)?: Support holding and the price position above the fast moving averages support tactical entry opportunities to seek an upside extension toward the upper band, managing risk with an adjusted Stop Loss.
Sell (Short)?: Trading to the downside carries high risk due to the strong underlying bullish trend; it would only be considered in the event of a major rejection in the resistance zone.
#Bitcoin #AnalisisTecnico #CryptoTrading
May the Lord bless and prosper the one who operates here, in the name of Jesus, because your word says: "Mine is the silver, and mine is the gold, says the LORD of hosts." Hageo 2:8 RV1960-T -
$BTC