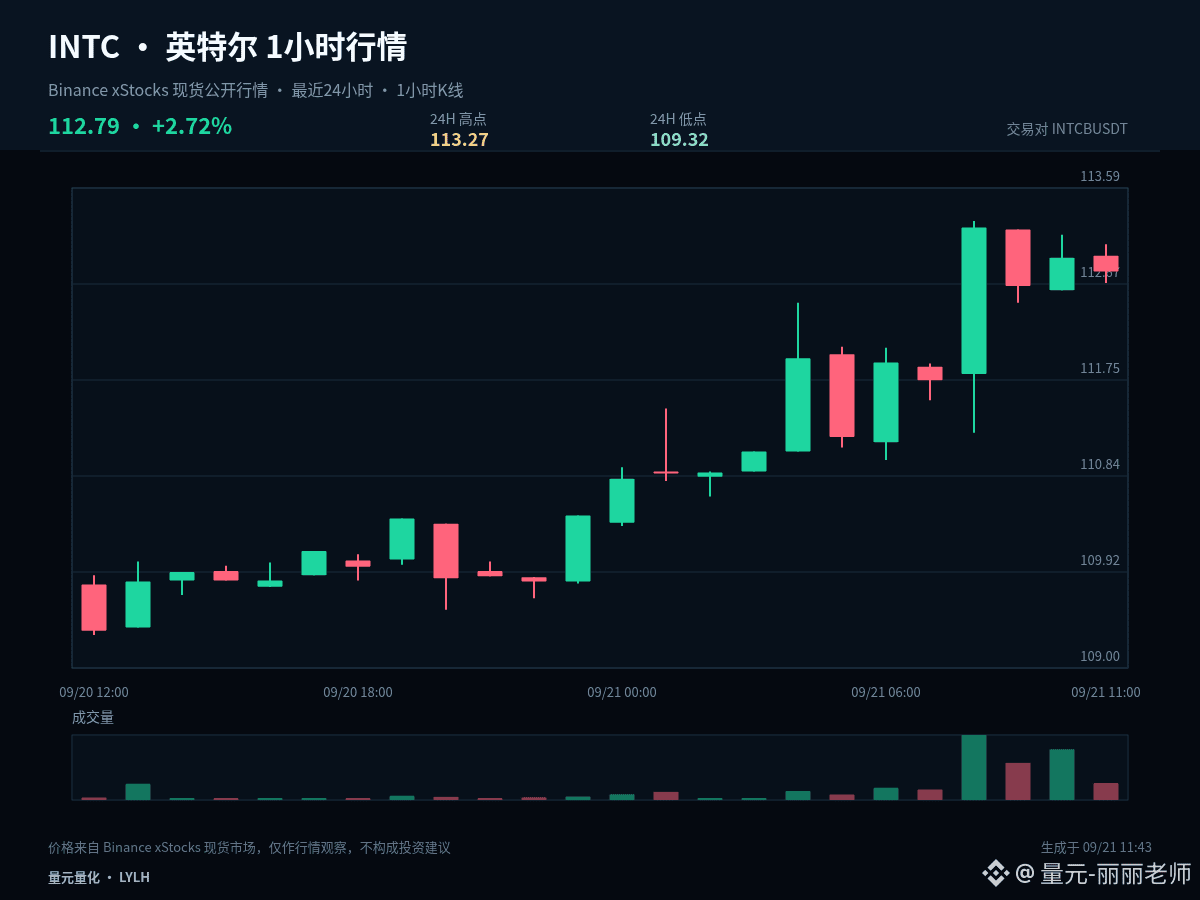
$INTCB #INTC It currently looks more like range trading and turnover than a new trend—there’s no need to explain every 1-hour candlestick as a fresh development. Current price: 112.79; 1 hour: -0.12%, 24 hours: +2.67%.
The current price is near the upper edge of the past 24-hour range: 1 hour -0.12%, 24 hours +2.67%. The most important thing at the top is confirming acceptance after a breakout. If price can stay above the upper edge, it shows the market recognizes a higher range. If it only briefly pierces and quickly reclaims, you need to watch out for a false breakout.
The range upper boundary is 113.27, the lower boundary is 109.32, and the midline is 111.295. When near the upper boundary, observe the breakout quality; when near the lower boundary, observe support/absorption. Around the midline, reduce frequent trading because it’s not far enough from either side, so direction and risk-reward are unclear.
The signals worth acting on are: after the price breaks a boundary, it’s willing to stay in the new range; or after it dips to a boundary, it quickly snaps back. Without this confirmation, keep treating it as consolidation and don’t let temporary intraday fluctuations change the overall plan.
For existing positions, handle them in segments around key levels to avoid making all decisions at once. For those who are currently in cash, wait for breakout confirmation or a pullback that holds. For US stock-related underlyings, also pay attention to volatility caused by trading session transitions—the plan should follow price conditions; don’t let emotions replace execution.
Risk control still comes before the conclusion: only execute when conditions appear; if the price invalidates the setup, reassess promptly. The higher the volatility, the more restrained each position should be. The above is a market projection based on current 1-hour and 24-hour data, and does not constitute any promise of returns.
#BOJRaisesRatesTo31YearHigh
The current price is near the upper edge of the past 24-hour range: 1 hour -0.12%, 24 hours +2.67%. The most important thing at the top is confirming acceptance after a breakout. If price can stay above the upper edge, it shows the market recognizes a higher range. If it only briefly pierces and quickly reclaims, you need to watch out for a false breakout.
The range upper boundary is 113.27, the lower boundary is 109.32, and the midline is 111.295. When near the upper boundary, observe the breakout quality; when near the lower boundary, observe support/absorption. Around the midline, reduce frequent trading because it’s not far enough from either side, so direction and risk-reward are unclear.
The signals worth acting on are: after the price breaks a boundary, it’s willing to stay in the new range; or after it dips to a boundary, it quickly snaps back. Without this confirmation, keep treating it as consolidation and don’t let temporary intraday fluctuations change the overall plan.
For existing positions, handle them in segments around key levels to avoid making all decisions at once. For those who are currently in cash, wait for breakout confirmation or a pullback that holds. For US stock-related underlyings, also pay attention to volatility caused by trading session transitions—the plan should follow price conditions; don’t let emotions replace execution.
Risk control still comes before the conclusion: only execute when conditions appear; if the price invalidates the setup, reassess promptly. The higher the volatility, the more restrained each position should be. The above is a market projection based on current 1-hour and 24-hour data, and does not constitute any promise of returns.
#BOJRaisesRatesTo31YearHigh