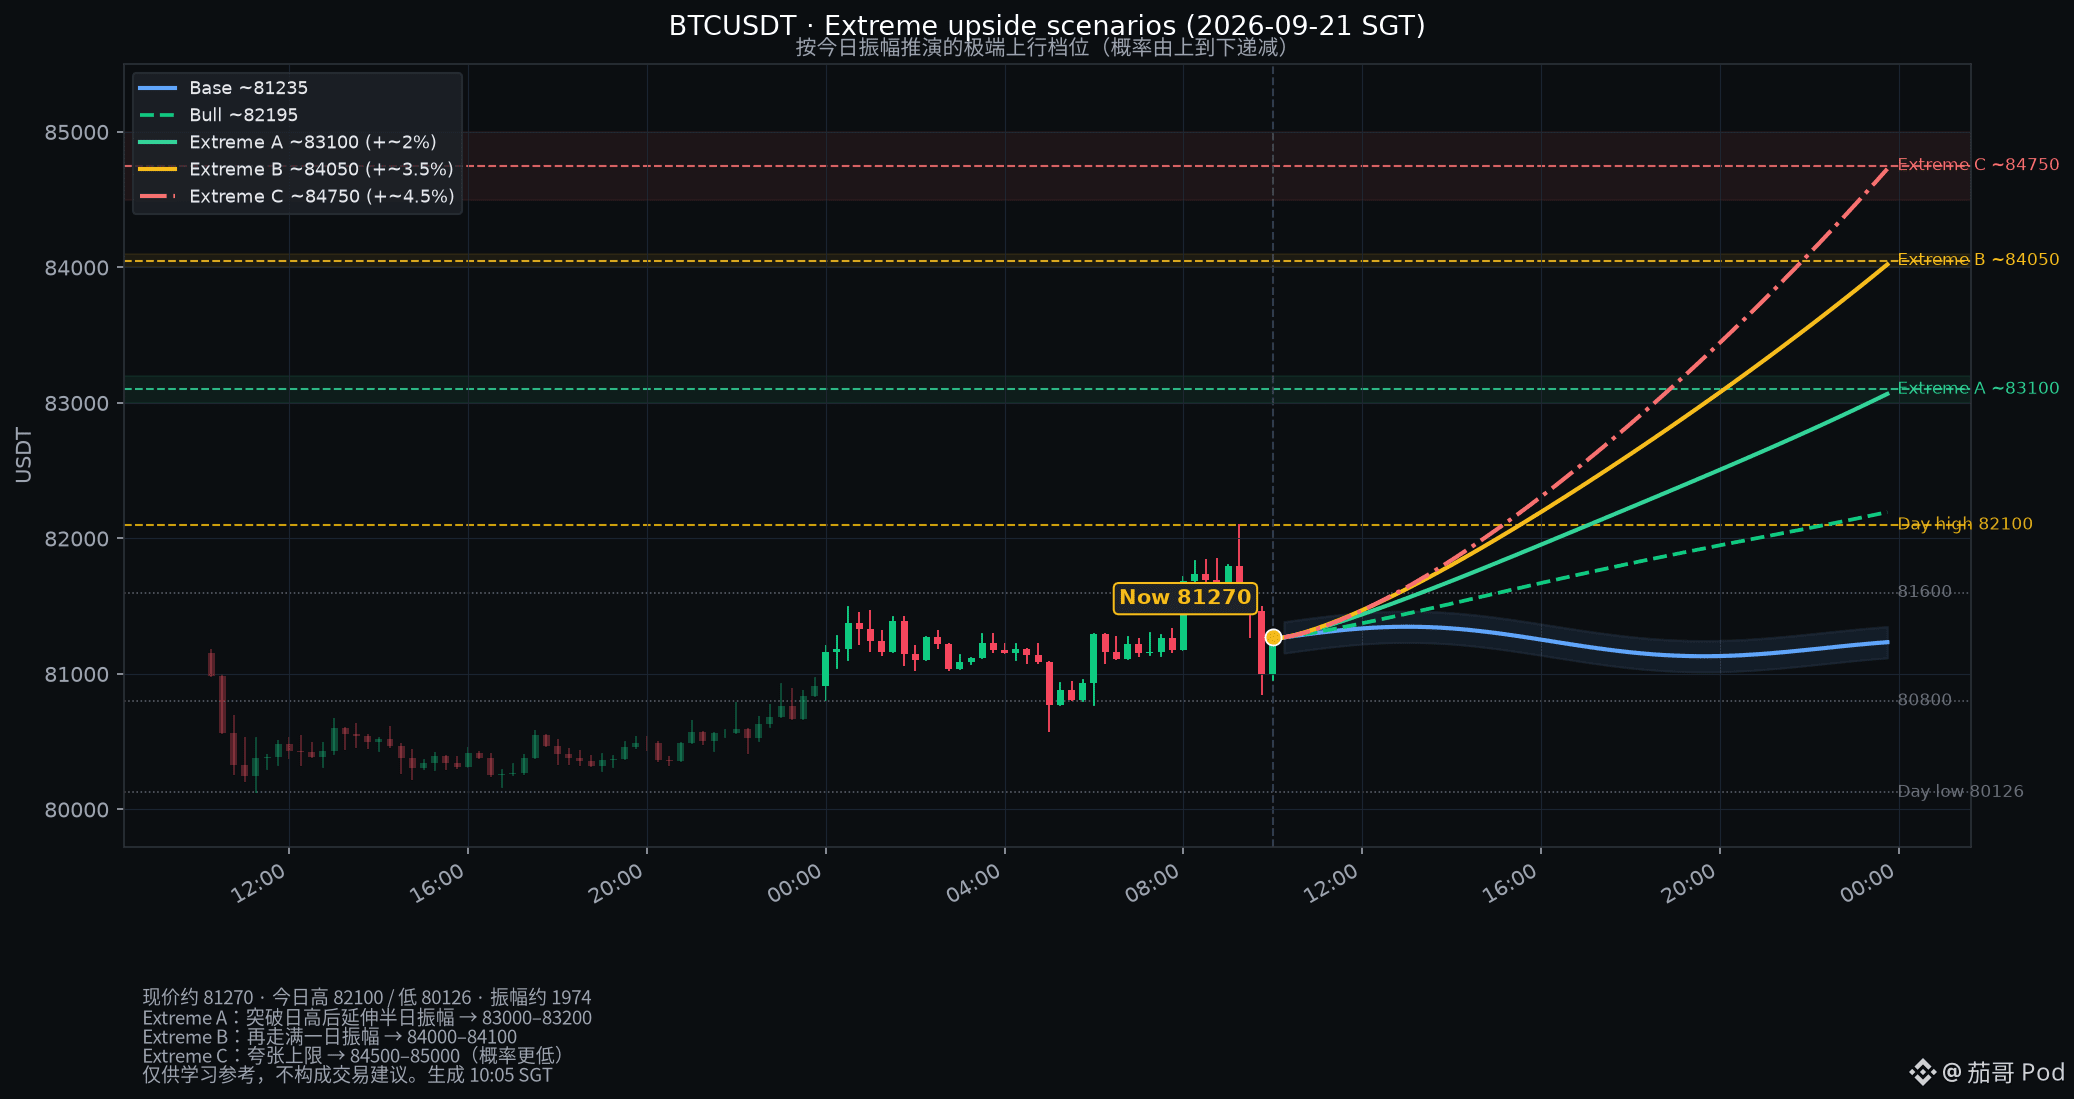

Based on the structure already built today (high about 82100, low about 80126, amplitude about 1970 points, current price about 81270), you can view extreme upside like this:
Green: Extreme A ≈ 83000–83200 (the more common type of extreme)
Yellow: Extreme B ≈ 84000–84100 (fills out the day’s full amplitude)
Red: Extreme C ≈ 84500–85000 (an even more exaggerated upper limit)
Relative to the current price, it’s roughly in the +2%, +3.5%, up to nearly +5% range. Today it already surged above today’s high 82100 and then pulled back. For it to push beyond 84000+, it needs a new breakout backed by increased volume—it’s not the baseline scenario.
The dashed line in the chart is a scenario path, not a guarantee that price will reach those levels. This is only an amplitude projection for reference; it does not constitute trading advice.
Green: Extreme A ≈ 83000–83200 (the more common type of extreme)
Yellow: Extreme B ≈ 84000–84100 (fills out the day’s full amplitude)
Red: Extreme C ≈ 84500–85000 (an even more exaggerated upper limit)
Relative to the current price, it’s roughly in the +2%, +3.5%, up to nearly +5% range. Today it already surged above today’s high 82100 and then pulled back. For it to push beyond 84000+, it needs a new breakout backed by increased volume—it’s not the baseline scenario.
The dashed line in the chart is a scenario path, not a guarantee that price will reach those levels. This is only an amplitude projection for reference; it does not constitute trading advice.