


From the buying rush climax—learn how to distinguish between bullish warning signals and top confirmation.
The price keeps climbing. Then suddenly it pulls out a longer bullish candle, and the trading volume expands noticeably. At this point, it’s easy to think: "Since buyers are so enthusiastic, it should still keep going up, right?"
After reading (Wyckoff Trading Method) Section 6, I wrote down a question: after this round of concentrated chasing, can the uptrend still hold? This is one way to enter the understanding of the "buying rush climax".#BTC
A buying rush climax—what does it remind us to watch for?
In the previous lesson, we put position, amplitude, close, and relative volume together. This time, we connect those details into a process, and figure out why, when the upmove is at its most lively, we still need to pay attention to supply.
In the original book, buying climax is discussed in the context of a bull market, abbreviated BC, short for Buying Climax. It describes a phenomenon during an uptrend where chase-buying becomes concentrated, and both trading volume and price volatility expand noticeably. In Figures 1–13, the price first moves upward; then a long bullish candle making a new high with a very large volume appears, followed by a pullback.
The author explains the buying-climax as the public fearing missing out while CM uses the opportunity to sell; CM is the dominant capital role in the book. A footnote also mentions that aggressive buying concentrated together consumes the buyers’ own strength. What’s worth watching here is: active buying right now doesn’t mean it can be continuously carried forward later. If supply starts to block the advance, the rally could stall.
Every trade includes both a buyer and a seller; “a large amount of sell orders being filled” by itself cannot prove that supply is dominant. When reading the chart, we should observe whether the price can still advance after this round of concentrated buying, how deep the pullback goes, and whether subsequent pushes are blocked. This lesson has no institutional identity or position evidence, so we can’t directly treat the author’s role explanation as confirmed sell-off facts in BTC.
A footnote in the original book reminds: later, there may be a natural pullback or sideways movement; if there’s a test or another rise afterward, then it’s clearer. Here you can initially understand “natural pullback” as prices retreating after a sharp surge; “test” means you check the reaction of price afterward to see whether the prior supply-demand explanation still holds. None of these equal the top already being established. If the pullback is weak, supply may not have expanded or may be getting consumed, and the price can still continue to rise.
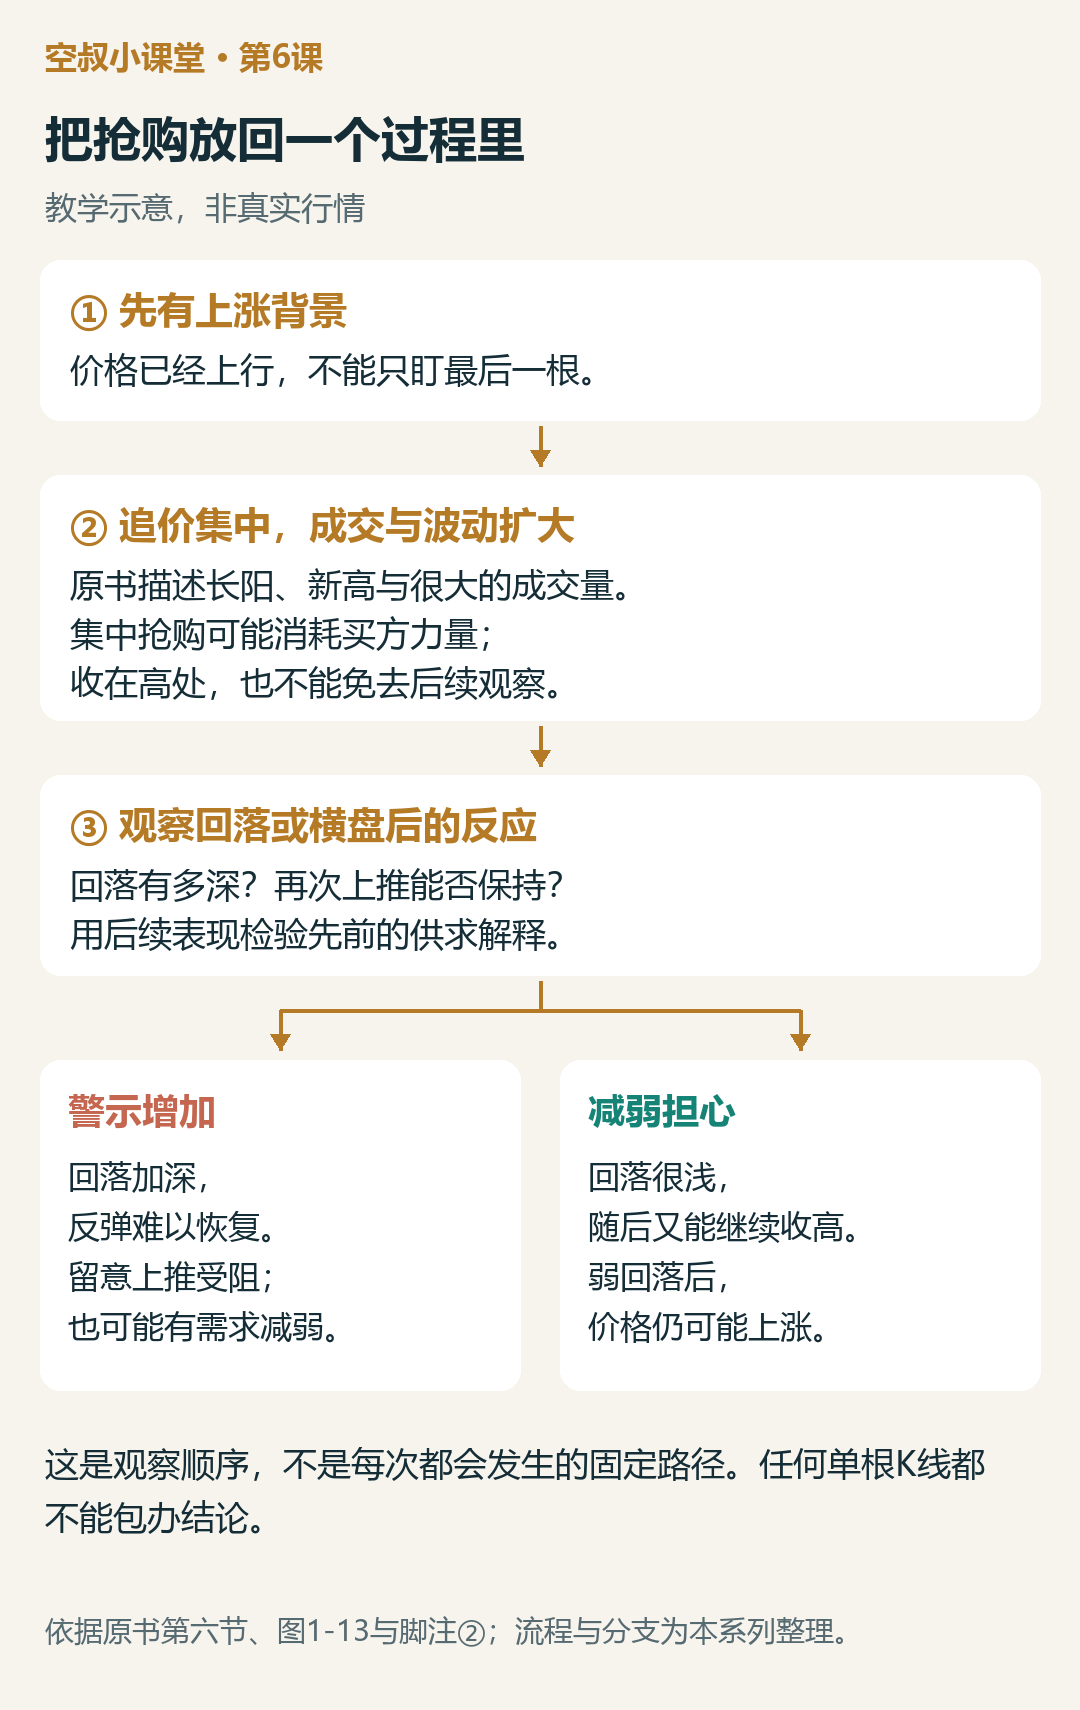
The process and branches in this series are a learning reorganization of the original book—not a fixed path that happens every time.
Stop there for now: is this long bullish candle enough to qualify as a “confirmation”?
Below are post-event teaching examples from Binance’s BTCUSDT U-margined USDT perpetual 4-hour candlestick price data. Everything is standardized to UTC+8, and the axis marks the opening time; the price unit is USDT, and the volume unit is BTC. First, fix the analysis cut-off at 00:00 on September 19, 2026, and only use already-closed data up to that point.
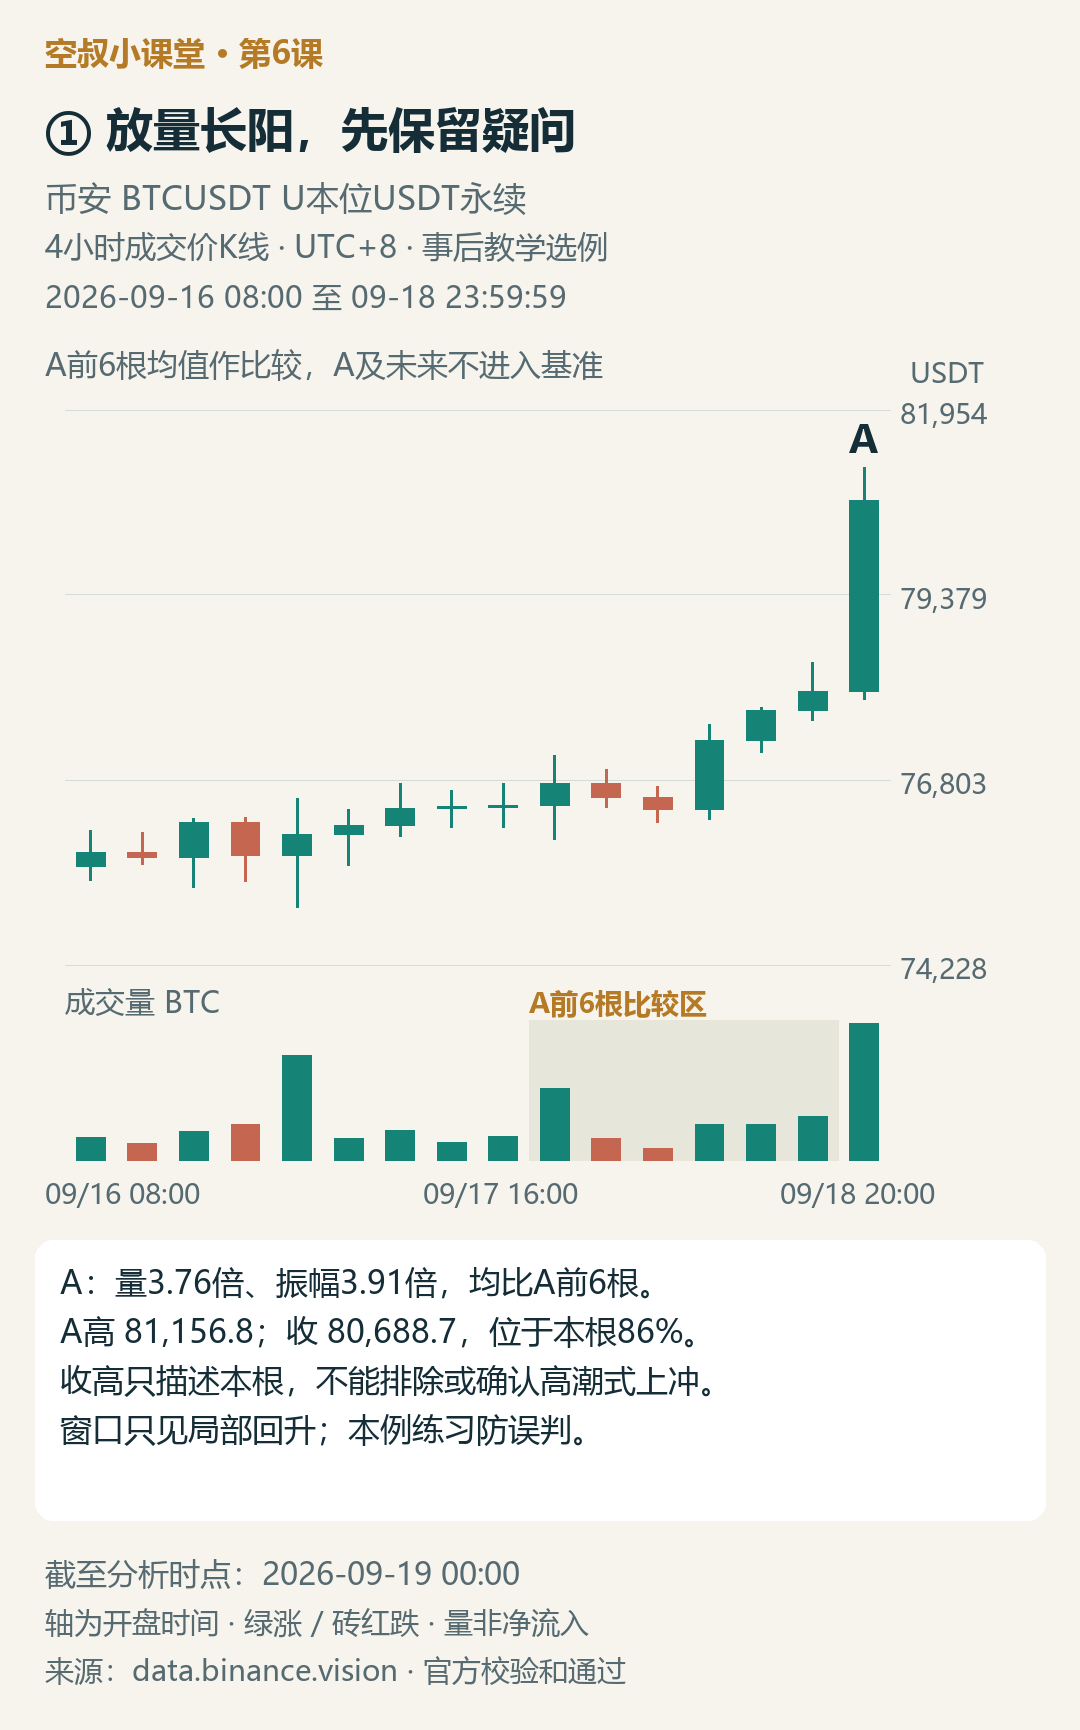
In Figure 2, the price first consolidates, then recovers. From 08:00 on September 18, it closes higher continuously. A is the candle at 20:00 on the 18th: it opened at 78,031.0, reached a high of 81,156.8, and closed at 80,688.7—exceeding the previous window’s high of 78,443.0.
A’s成交约93,465 BTC, about 3.76 times the average volume of the previous six candles; the range (highest minus lowest) is 3,233.3, which is 3.91 times the previous average range. The comparison window is the 24 hours before A, excluding A itself. This is a supplementary definition for the series; without correcting for time differences, the multiple is not a threshold for identifying BC.
A’s close is at about 86% of the range of this candle, which suggests most of this 4-hour rally was preserved into the close. But closing high neither rules out a climax-style spike nor confirms it; you still need to observe whether the subsequent rally runs into resistance. You can’t treat “closing high” as a safety guarantee.
The current window only shows a partial recovery, which is not enough to judge whether there was already a sufficient upswing process beforehand. This example specifically practices avoiding misjudgment: although there are a long bullish candle, high volume, and a new high in appearance, the background and subsequent evidence are still insufficient. Therefore, we do not label it as an already-formed buying climax.
Write the conditions first, then look at what happens next
Before revealing what comes next, I will write the observations in two parts:
If the price continues to fall back below A’s close at 80,688.7, and the rebound can’t reclaim it, the warning about the advance being blocked will increase. If it continues to fall back toward A’s start point at 78,031.0, that indicates the acceleration progress has been lost even more. But a pullback may also include reduced chase-buying demand, so it can’t be counted alone as proof that the sell side is strengthening.
On the other hand, if the pullback is shallow and then the price can continue to close higher, you should reduce your concern that the move-up is being blocked. If it further breaks above A’s high at 81,156.8 and holds, then the evidence is stronger. You can’t treat a slight poke above as confirmation.
These price levels come from A up to the cut-off; they’re just reference points for this example, not trading parameters from the original book.
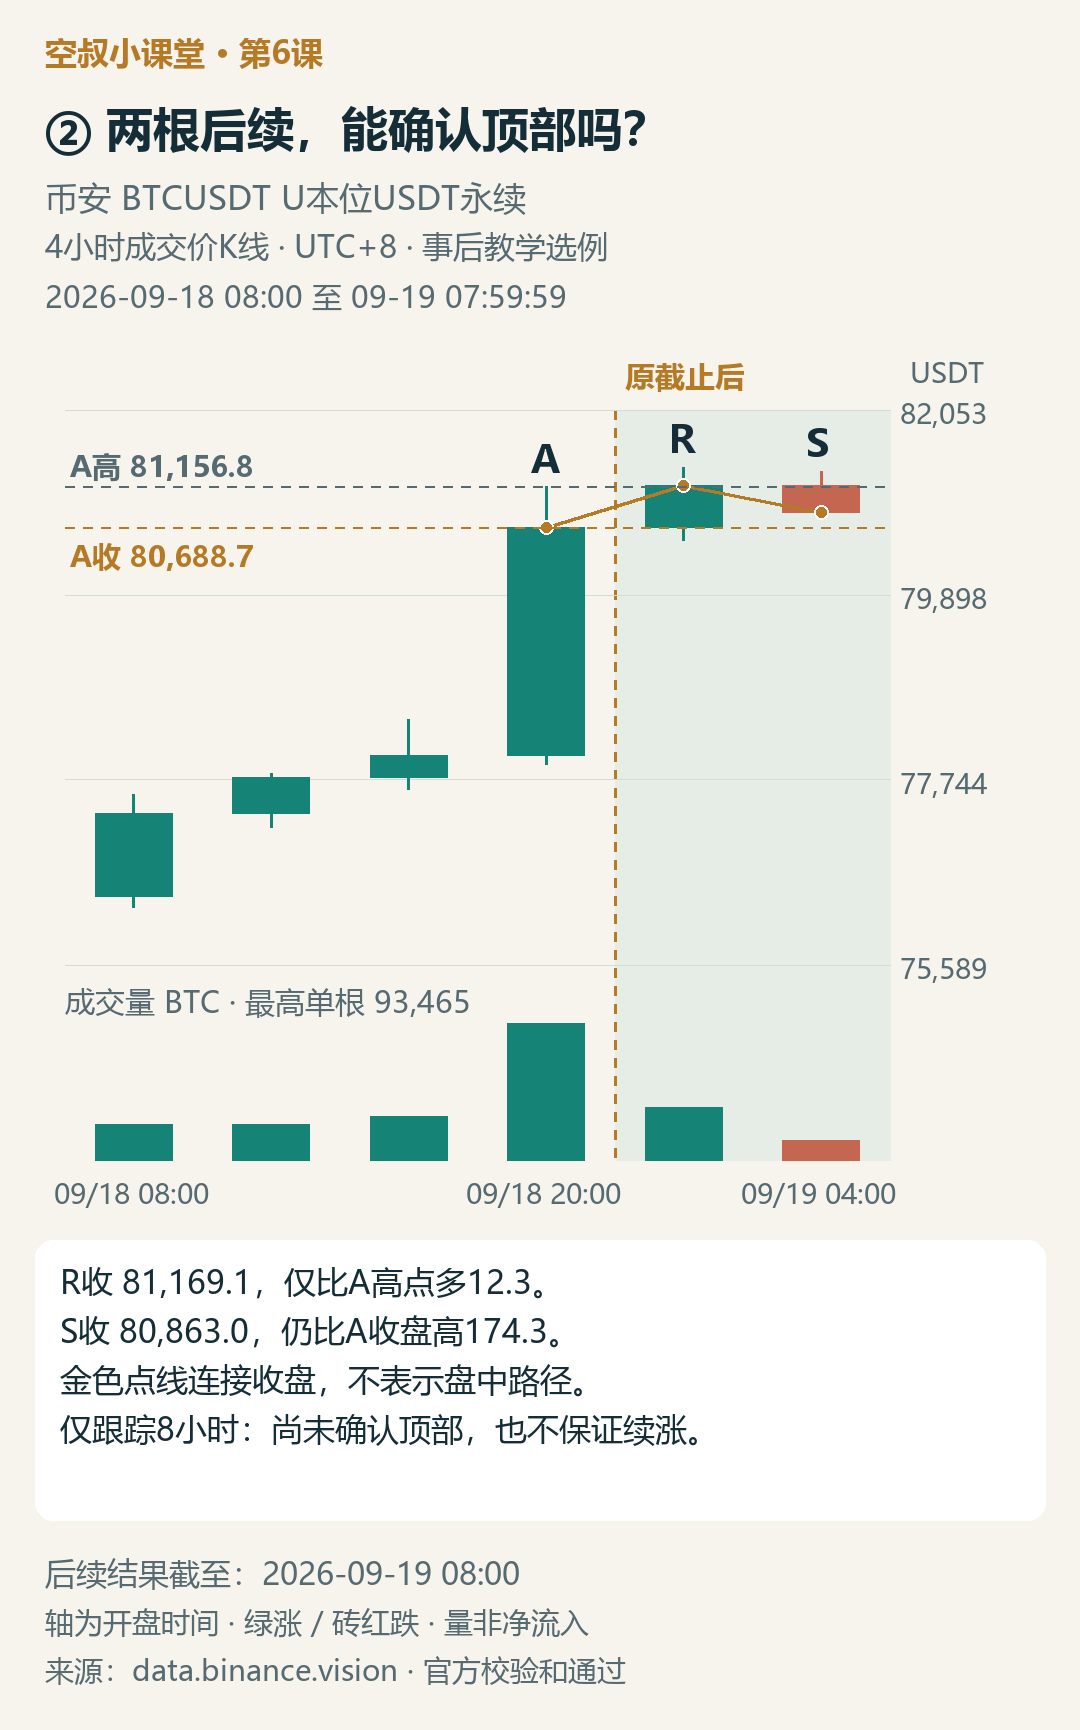
Figure 3 separately shows the results as of 08:00 on September 19. On the right side of the dividing line, R and S were still unknown at the time the original analysis was cut off, so you can’t use them to rewrite the judgment made then.
R closed at 81,169.1, which is 480.4 higher than A’s closing price, but only 12.3 higher than A’s intraday high. The two dashed lines in the chart mark A’s high and its close, so you can compare directly. S then pulled back and closed at 80,863.0, still 174.3 higher than A’s closing price.
R continues to close higher, and S then pulls back, but both candles close above A’s closing price. Therefore, as of this cut-off point, the pre-written condition—“staying back below A’s close continuously, and the rebound can’t reclaim”—has not appeared. S closing near its own low is worth watching, but it’s not enough to prove the top. Since we only tracked for 8 hours, the conclusion remains “not yet confirmed,” and we also can’t guarantee that the price will continue to rise afterward.
My learning summary
This section on the buying climax reminded me: link the already-existing rise, the concentrated chase-buying, the subsequent pullback, and the push-up again when you look. A high-volume long bullish candle is worth paying attention to; closing near the top doesn’t eliminate the need for further observation. Your judgment should follow the evidence.
Total volume is not the same as net capital inflow, and it’s not the same as changes in institutional positions. Be cautious with actions that “reduce to” an instant conclusion—pause adding claims, wait for more already-closed evidence. You don’t have to immediately turn it into a short signal.
Leave a little practice exercise
Someone said, “A closed at about 86% of this range, so it definitely isn’t a buying climax.” Another person said, “S closed near the low of this range, so the top has already been confirmed.” Point out what evidence is missing for each of the two statements, and then write one follow-up condition that would strengthen the warning—without guessing whether the next candle will rise or fall.
Source: Meng Hongtao (Weeckoff Trading Method), Chapter 1, Section 6; printed pages 25–26, Figure 1–13, and footnote on page 25②. The market data is from Binance’s official public archive. The relative-volume approach and observation conditions are supplementary for the series; the BTC explanation is case-based inference. The historical chosen examples are not real-time forecasts, do not constitute trading advice, and do not prove a strategy’s win rate.
On the trading journey, Uncle Kong accompanies you as you grow.