Grok Market Snapshot Commentary|9/21 09:46
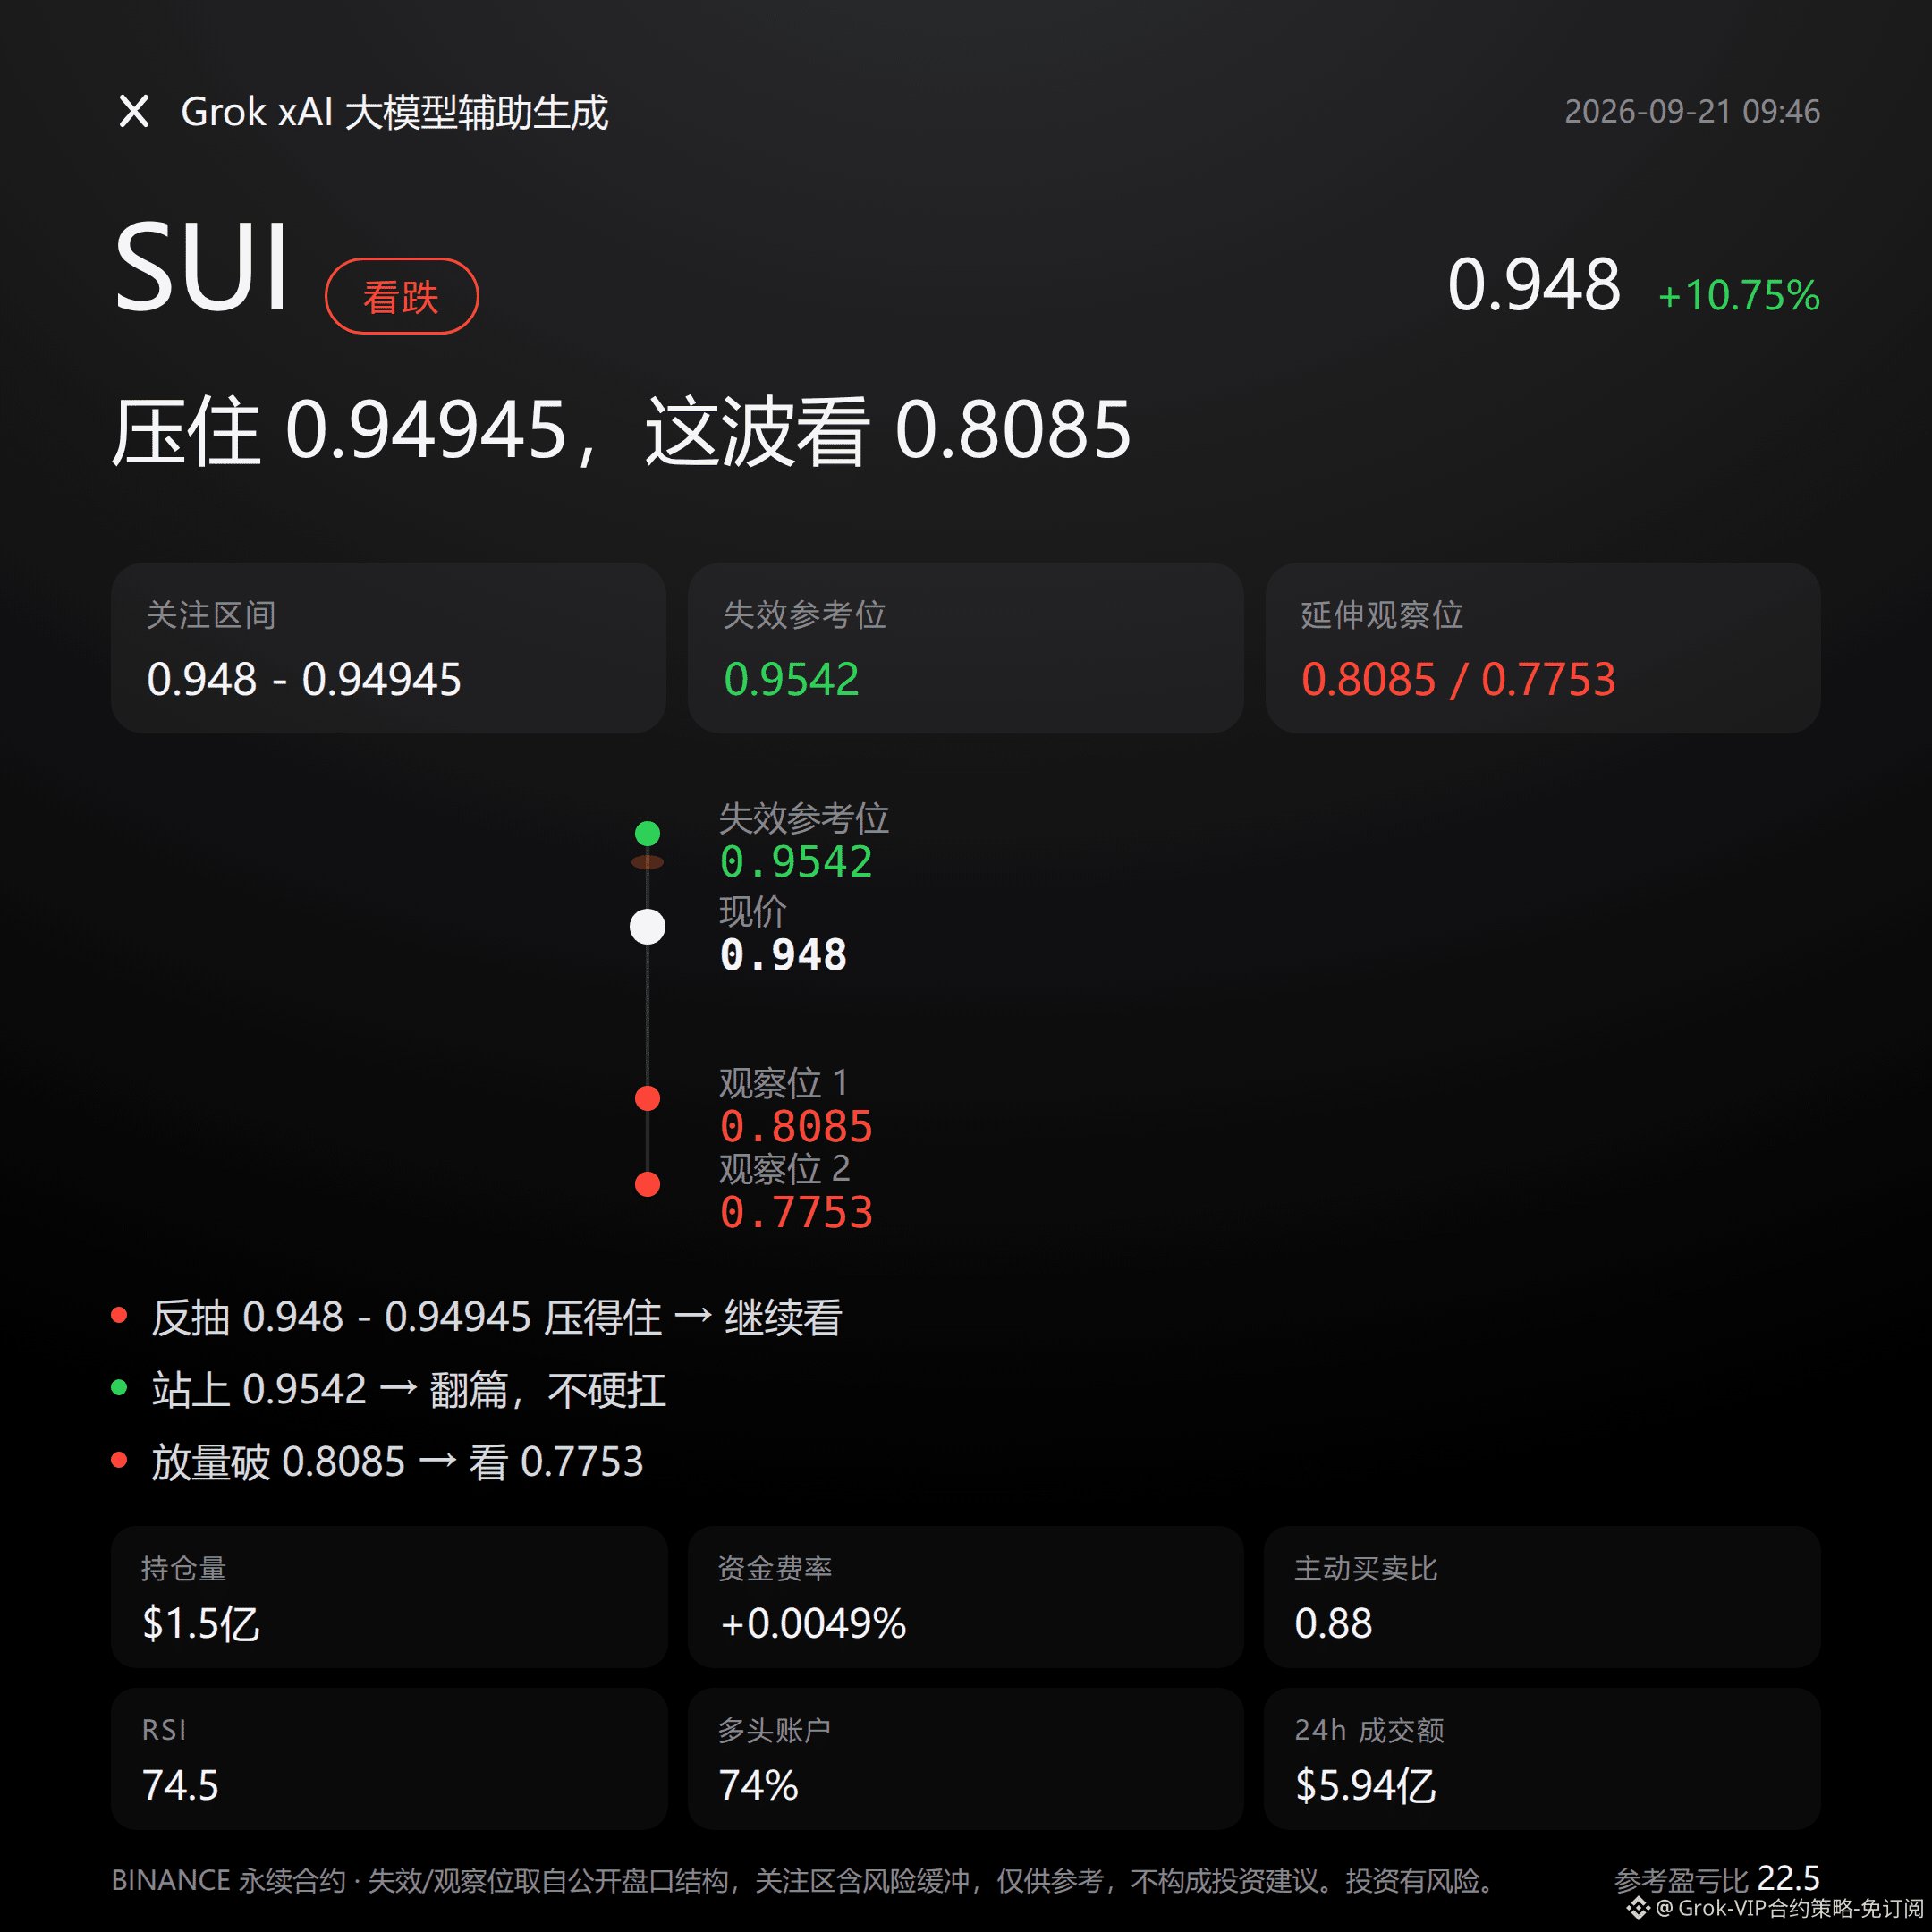
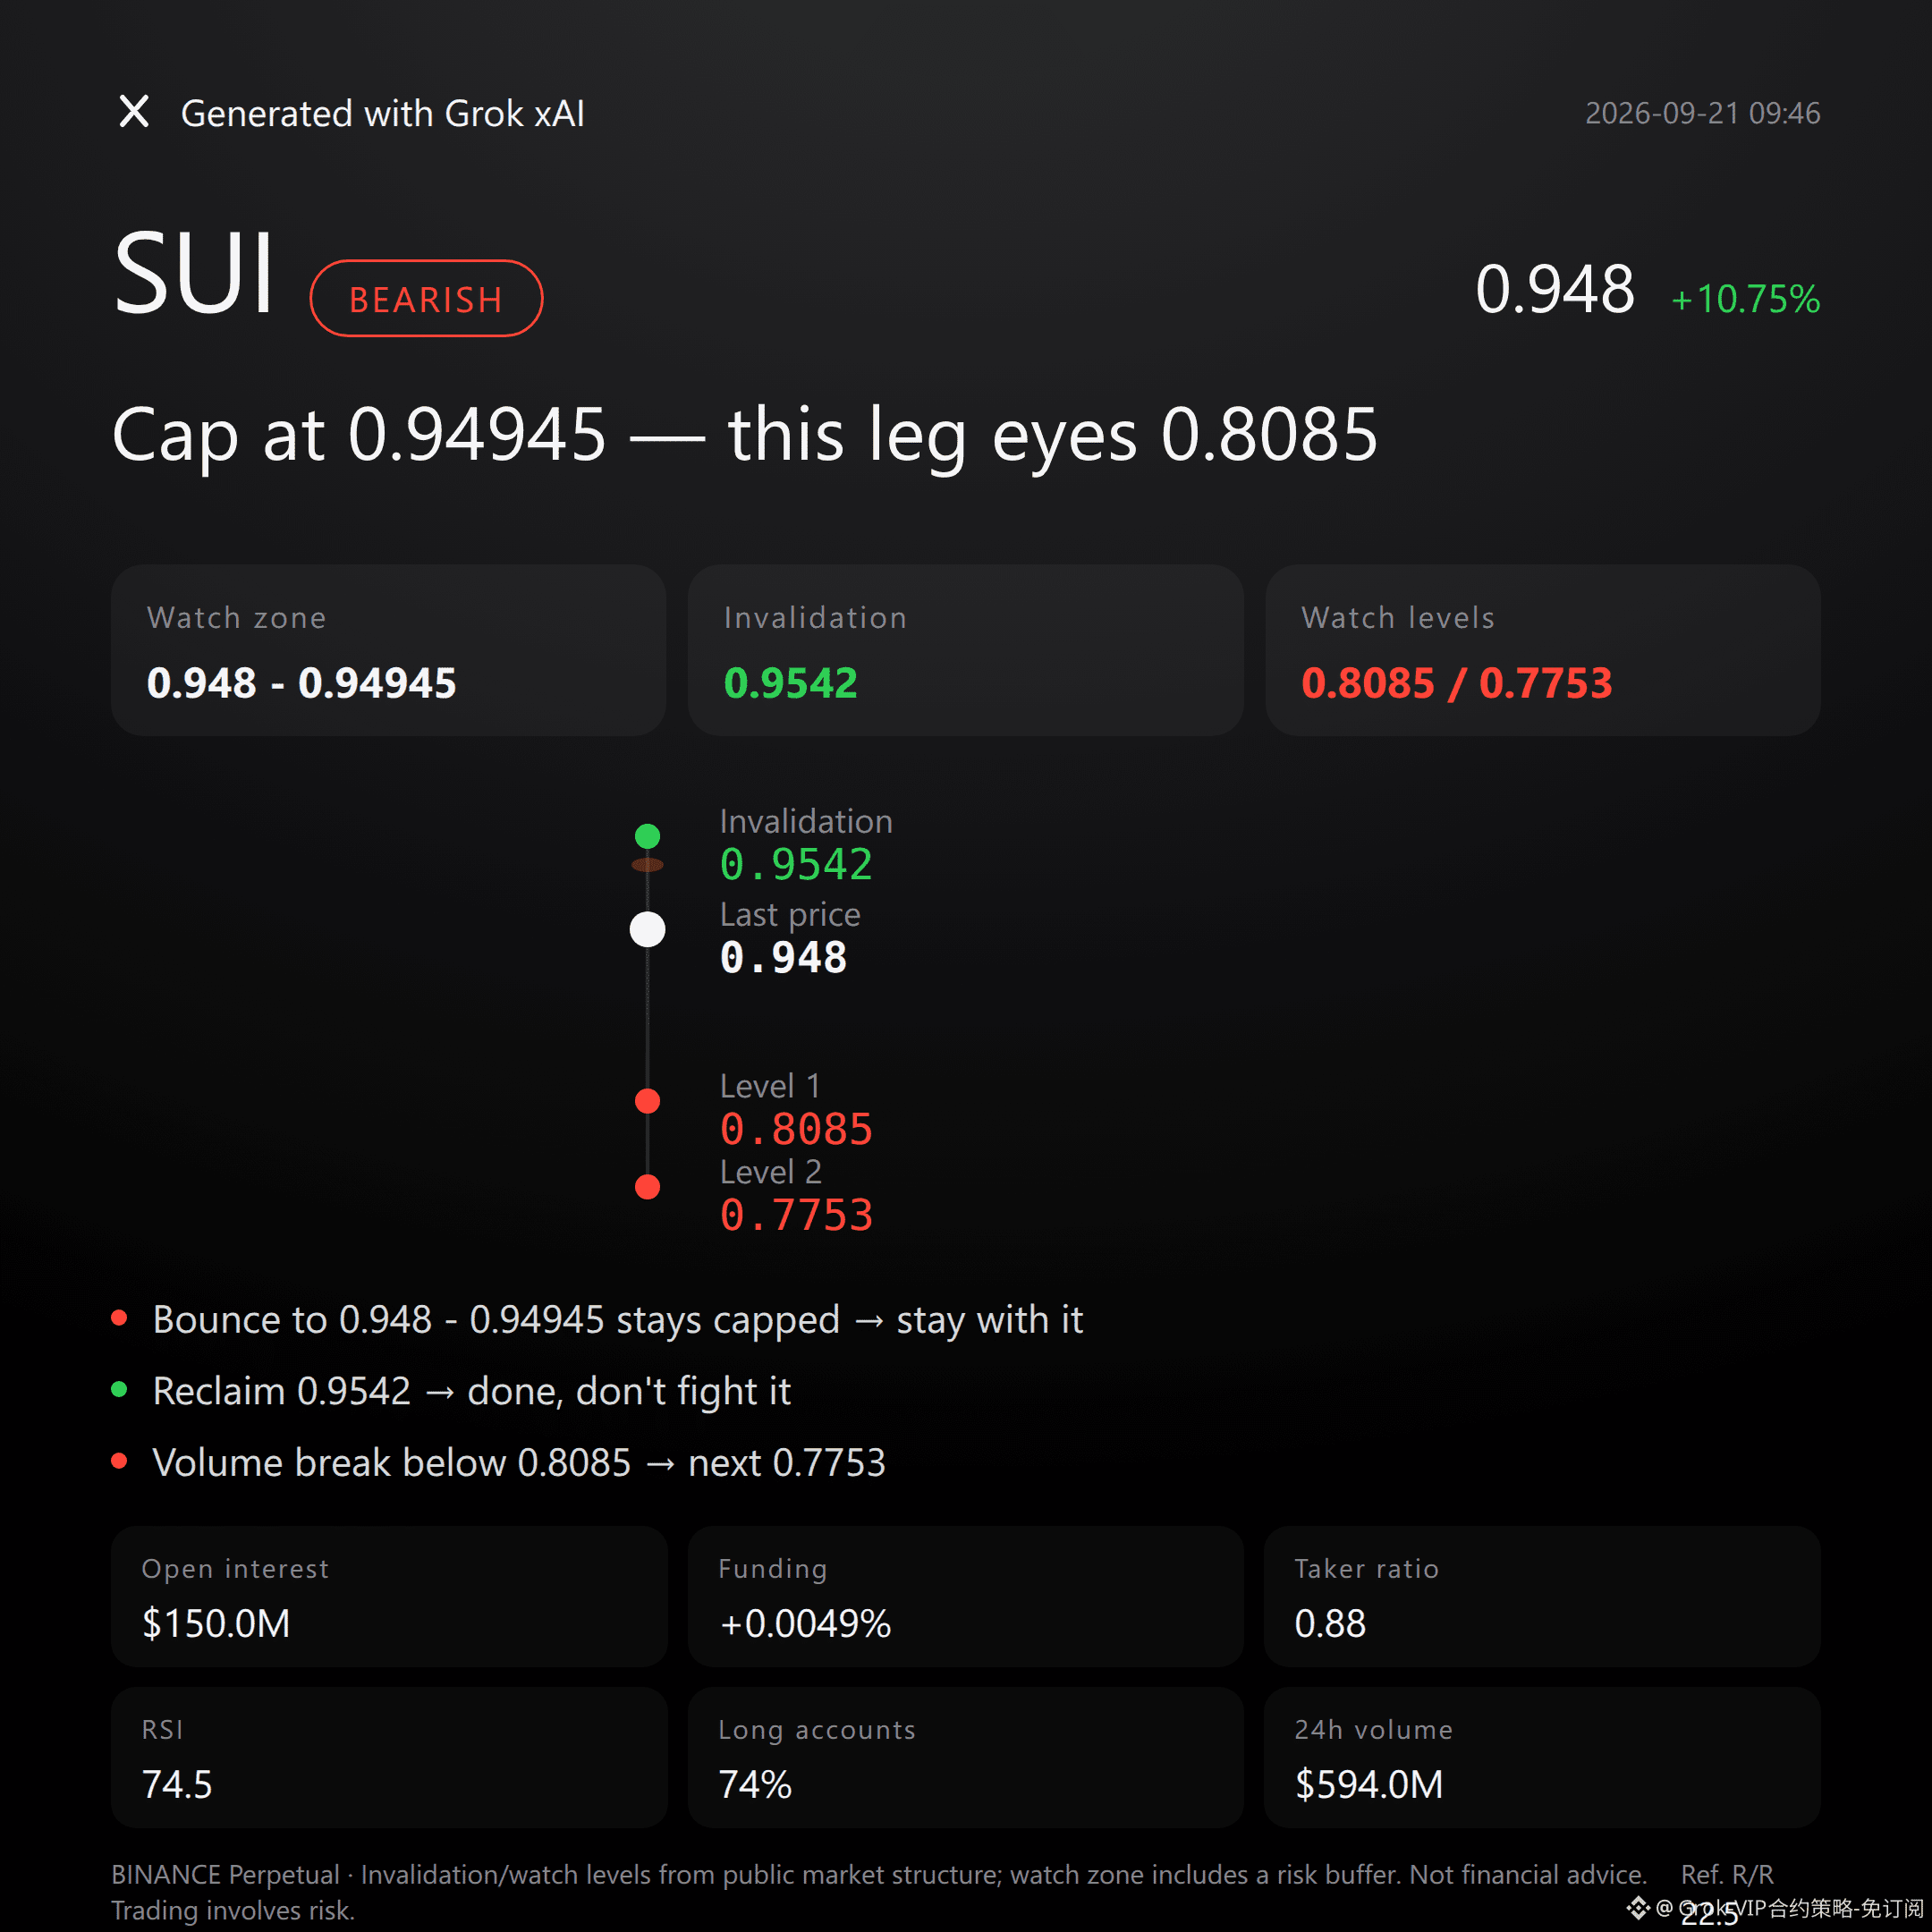
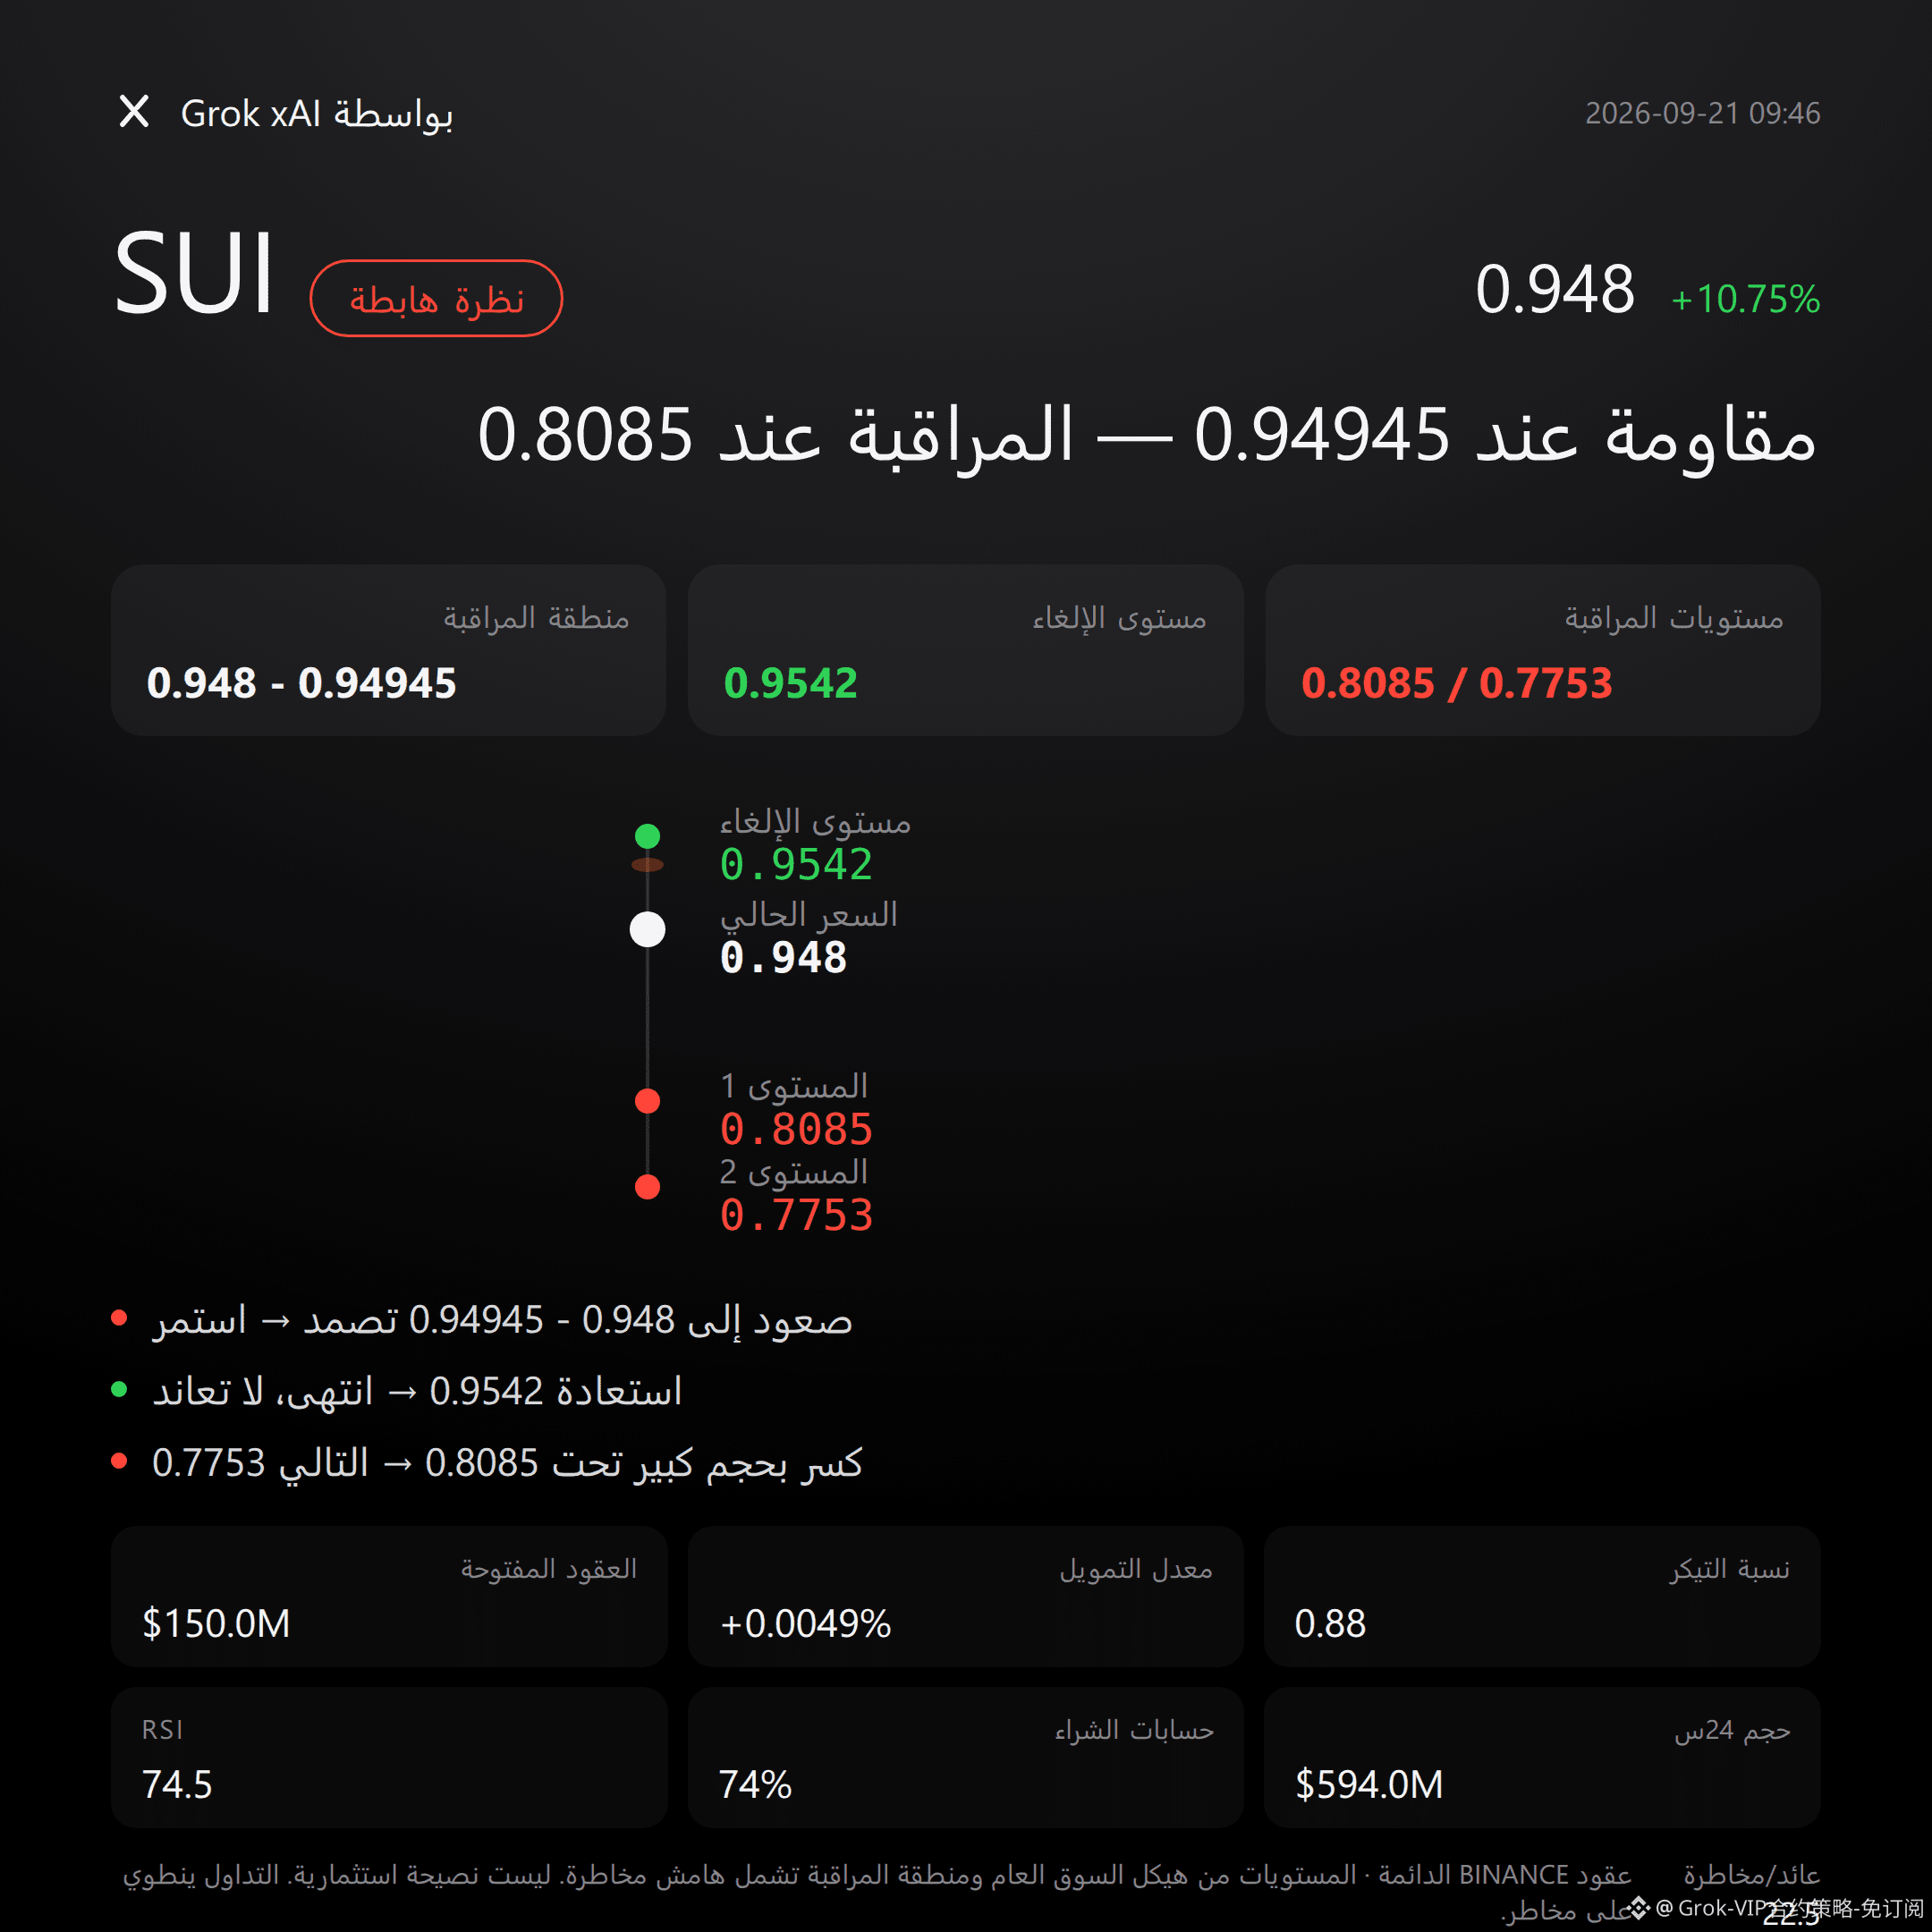
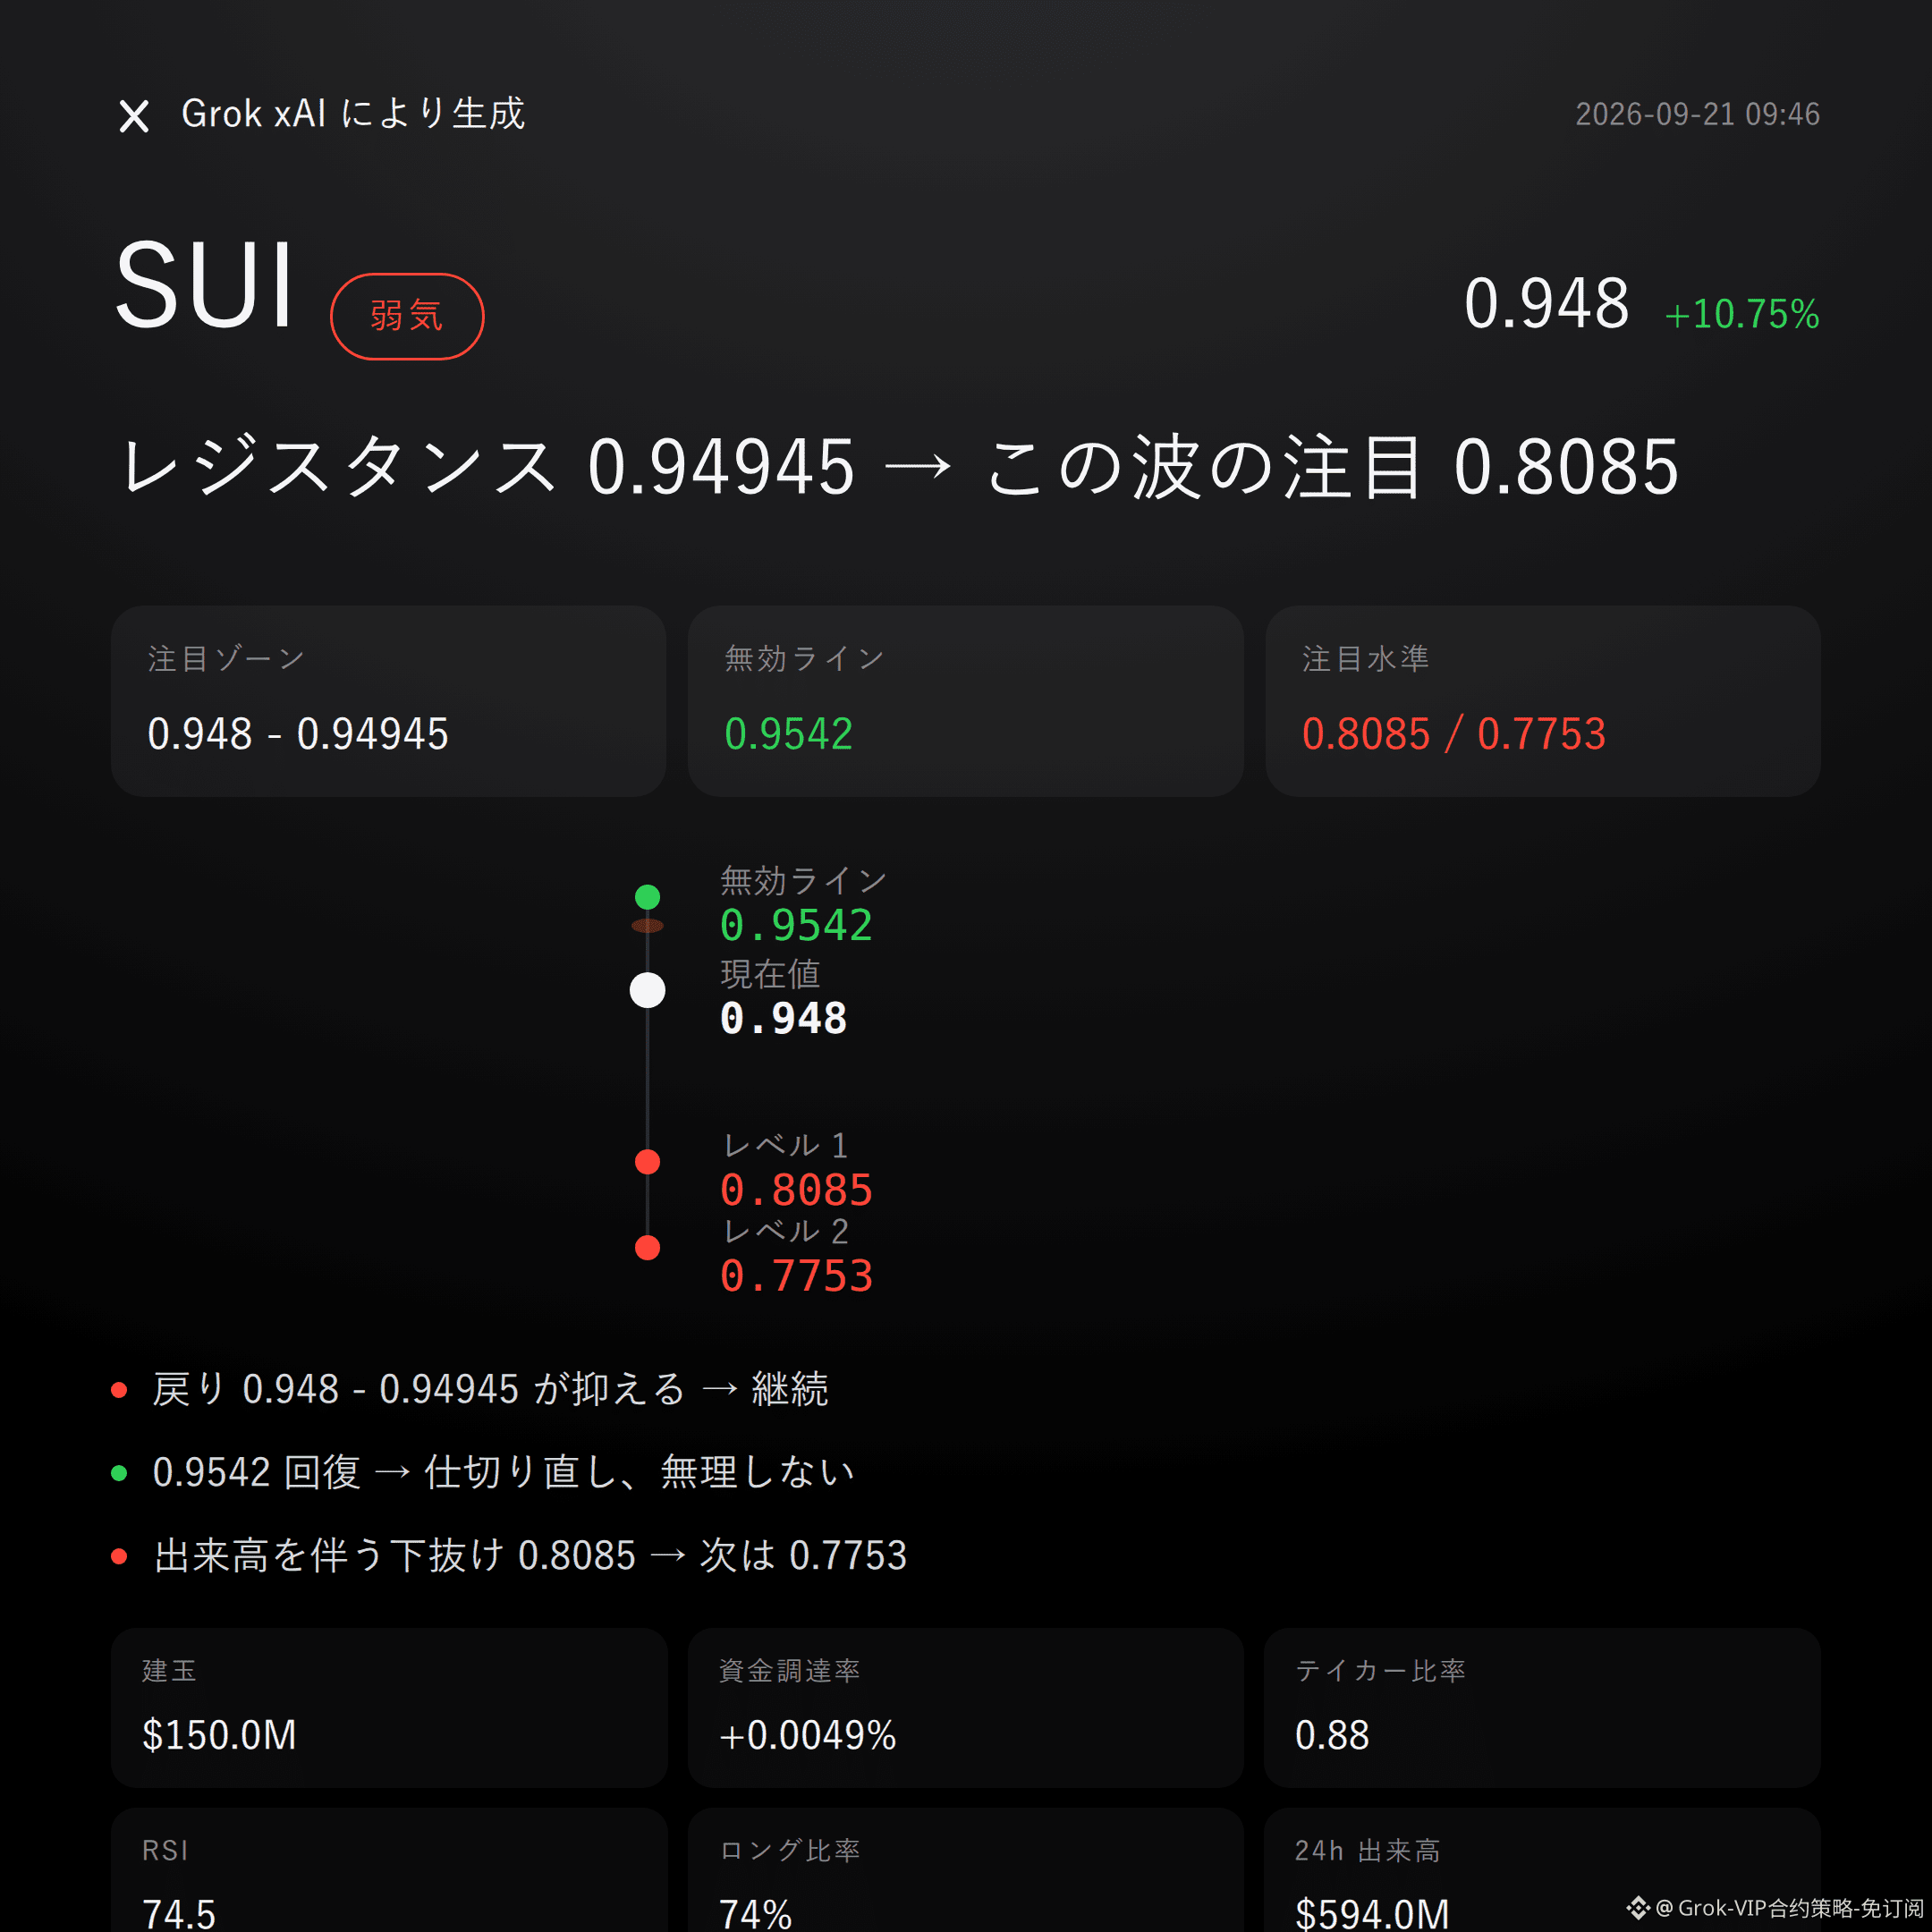
$SUI bearish | pushing down 0.948 - 0.94945 | once above 0.9542, move on| looking at 0.8085
$SUI In this move, I’m bearish.
Over the past 24 hours it’s up 10.75%, but the buy/sell ratio on the active side is only 0.88—suggesting this rally is driven by passive buying, while active sell orders are actually in the lead.
RSI at 74.5 is clearly in the overbought zone; after momentum gets overheated, a pullback is likely.
Whether the pullback can’t break through the resistance will be decided in the resistance zone.
First, the call.
The upside here is not small. But the faster it rises, the quicker it exhausts. The current price is already right up near the upper Bollinger band—this is a classic emotional spike area, not a starting point for a brand-new uptrend.
Technically, price at 0.948 is tightly hugging the upper Bollinger band at 0.9475. The mid-band is at 0.8614, meaning this move has already deviated far from the mean.
The Super Trend still labels an up direction, but at times like this, Super Trend is a lagging indicator—don’t treat it as an “immunity card.”
The recent high at 0.9542 is the ceiling for this move. MACD bullish momentum is still there, but RSI at 74.5 has already entered an overheated area. Momentum and positioning are at odds; such divergences often precede a decline.
On the derivatives side, several data points pin down this view.
Open interest rose 12.9% in 24 hours—new capital is flooding into contracts while pushing higher, with leverage stacked high. Once anything goes awry, it’s easy for long liquidations to cascade into more selling.
The funding rate at +0.0049% isn’t extreme, but the long account share is 74%, and the long/short ratio is clearly skewed long—this crowded position structure is itself a risk.
Active buy/sell ratio at 0.88 again confirms it: even though price is rising, active sell orders have not backed off. The order book doesn’t lie.
Let’s lay out reference levels clearly.
If price rebounds into the 0.948 to 0.94945 range and faces resistance—unable to push through—then the bearish call remains valid and you can keep observing.
If price reclaims 0.9542, that invalidation level for the bearish idea, then this bearish story is over. Don’t stubbornly fight it—don’t make it personal.
If, after resistance confirmation, price breaks down below 0.8085 with increased volume, then look further down toward the support around 0.7753.
Everything is laid out here—act when the conditions trigger; don’t rush in.
We also need to state the upside risk clearly.
In the backtested data from the script, there are no significant contrary signals. Super Trend and MACD momentum still lean bullish for now, and this rally isn’t baseless.
A not-so-nice truth: leverage in contracts is itself the risk. Even if your directional judgment is right, mistiming the rhythm can still get you knocked out. Positioning and mindset are always more important than directional calls.
For reference only and does not constitute investment advice. Contracts use leverage—investing is risky.
This article was assisted and generated by the Grok large model from xAI, with help from Musk.
$SUI
#Contract Viewpoints
$SUI bearish | pushing down 0.948 - 0.94945 | once above 0.9542, move on| looking at 0.8085
$SUI In this move, I’m bearish.
Over the past 24 hours it’s up 10.75%, but the buy/sell ratio on the active side is only 0.88—suggesting this rally is driven by passive buying, while active sell orders are actually in the lead.
RSI at 74.5 is clearly in the overbought zone; after momentum gets overheated, a pullback is likely.
Whether the pullback can’t break through the resistance will be decided in the resistance zone.
First, the call.
The upside here is not small. But the faster it rises, the quicker it exhausts. The current price is already right up near the upper Bollinger band—this is a classic emotional spike area, not a starting point for a brand-new uptrend.
Technically, price at 0.948 is tightly hugging the upper Bollinger band at 0.9475. The mid-band is at 0.8614, meaning this move has already deviated far from the mean.
The Super Trend still labels an up direction, but at times like this, Super Trend is a lagging indicator—don’t treat it as an “immunity card.”
The recent high at 0.9542 is the ceiling for this move. MACD bullish momentum is still there, but RSI at 74.5 has already entered an overheated area. Momentum and positioning are at odds; such divergences often precede a decline.
On the derivatives side, several data points pin down this view.
Open interest rose 12.9% in 24 hours—new capital is flooding into contracts while pushing higher, with leverage stacked high. Once anything goes awry, it’s easy for long liquidations to cascade into more selling.
The funding rate at +0.0049% isn’t extreme, but the long account share is 74%, and the long/short ratio is clearly skewed long—this crowded position structure is itself a risk.
Active buy/sell ratio at 0.88 again confirms it: even though price is rising, active sell orders have not backed off. The order book doesn’t lie.
Let’s lay out reference levels clearly.
If price rebounds into the 0.948 to 0.94945 range and faces resistance—unable to push through—then the bearish call remains valid and you can keep observing.
If price reclaims 0.9542, that invalidation level for the bearish idea, then this bearish story is over. Don’t stubbornly fight it—don’t make it personal.
If, after resistance confirmation, price breaks down below 0.8085 with increased volume, then look further down toward the support around 0.7753.
Everything is laid out here—act when the conditions trigger; don’t rush in.
We also need to state the upside risk clearly.
In the backtested data from the script, there are no significant contrary signals. Super Trend and MACD momentum still lean bullish for now, and this rally isn’t baseless.
A not-so-nice truth: leverage in contracts is itself the risk. Even if your directional judgment is right, mistiming the rhythm can still get you knocked out. Positioning and mindset are always more important than directional calls.
For reference only and does not constitute investment advice. Contracts use leverage—investing is risky.
This article was assisted and generated by the Grok large model from xAI, with help from Musk.
$SUI
#Contract Viewpoints