Grok Market Snapshot Commentary|9/21 08:46
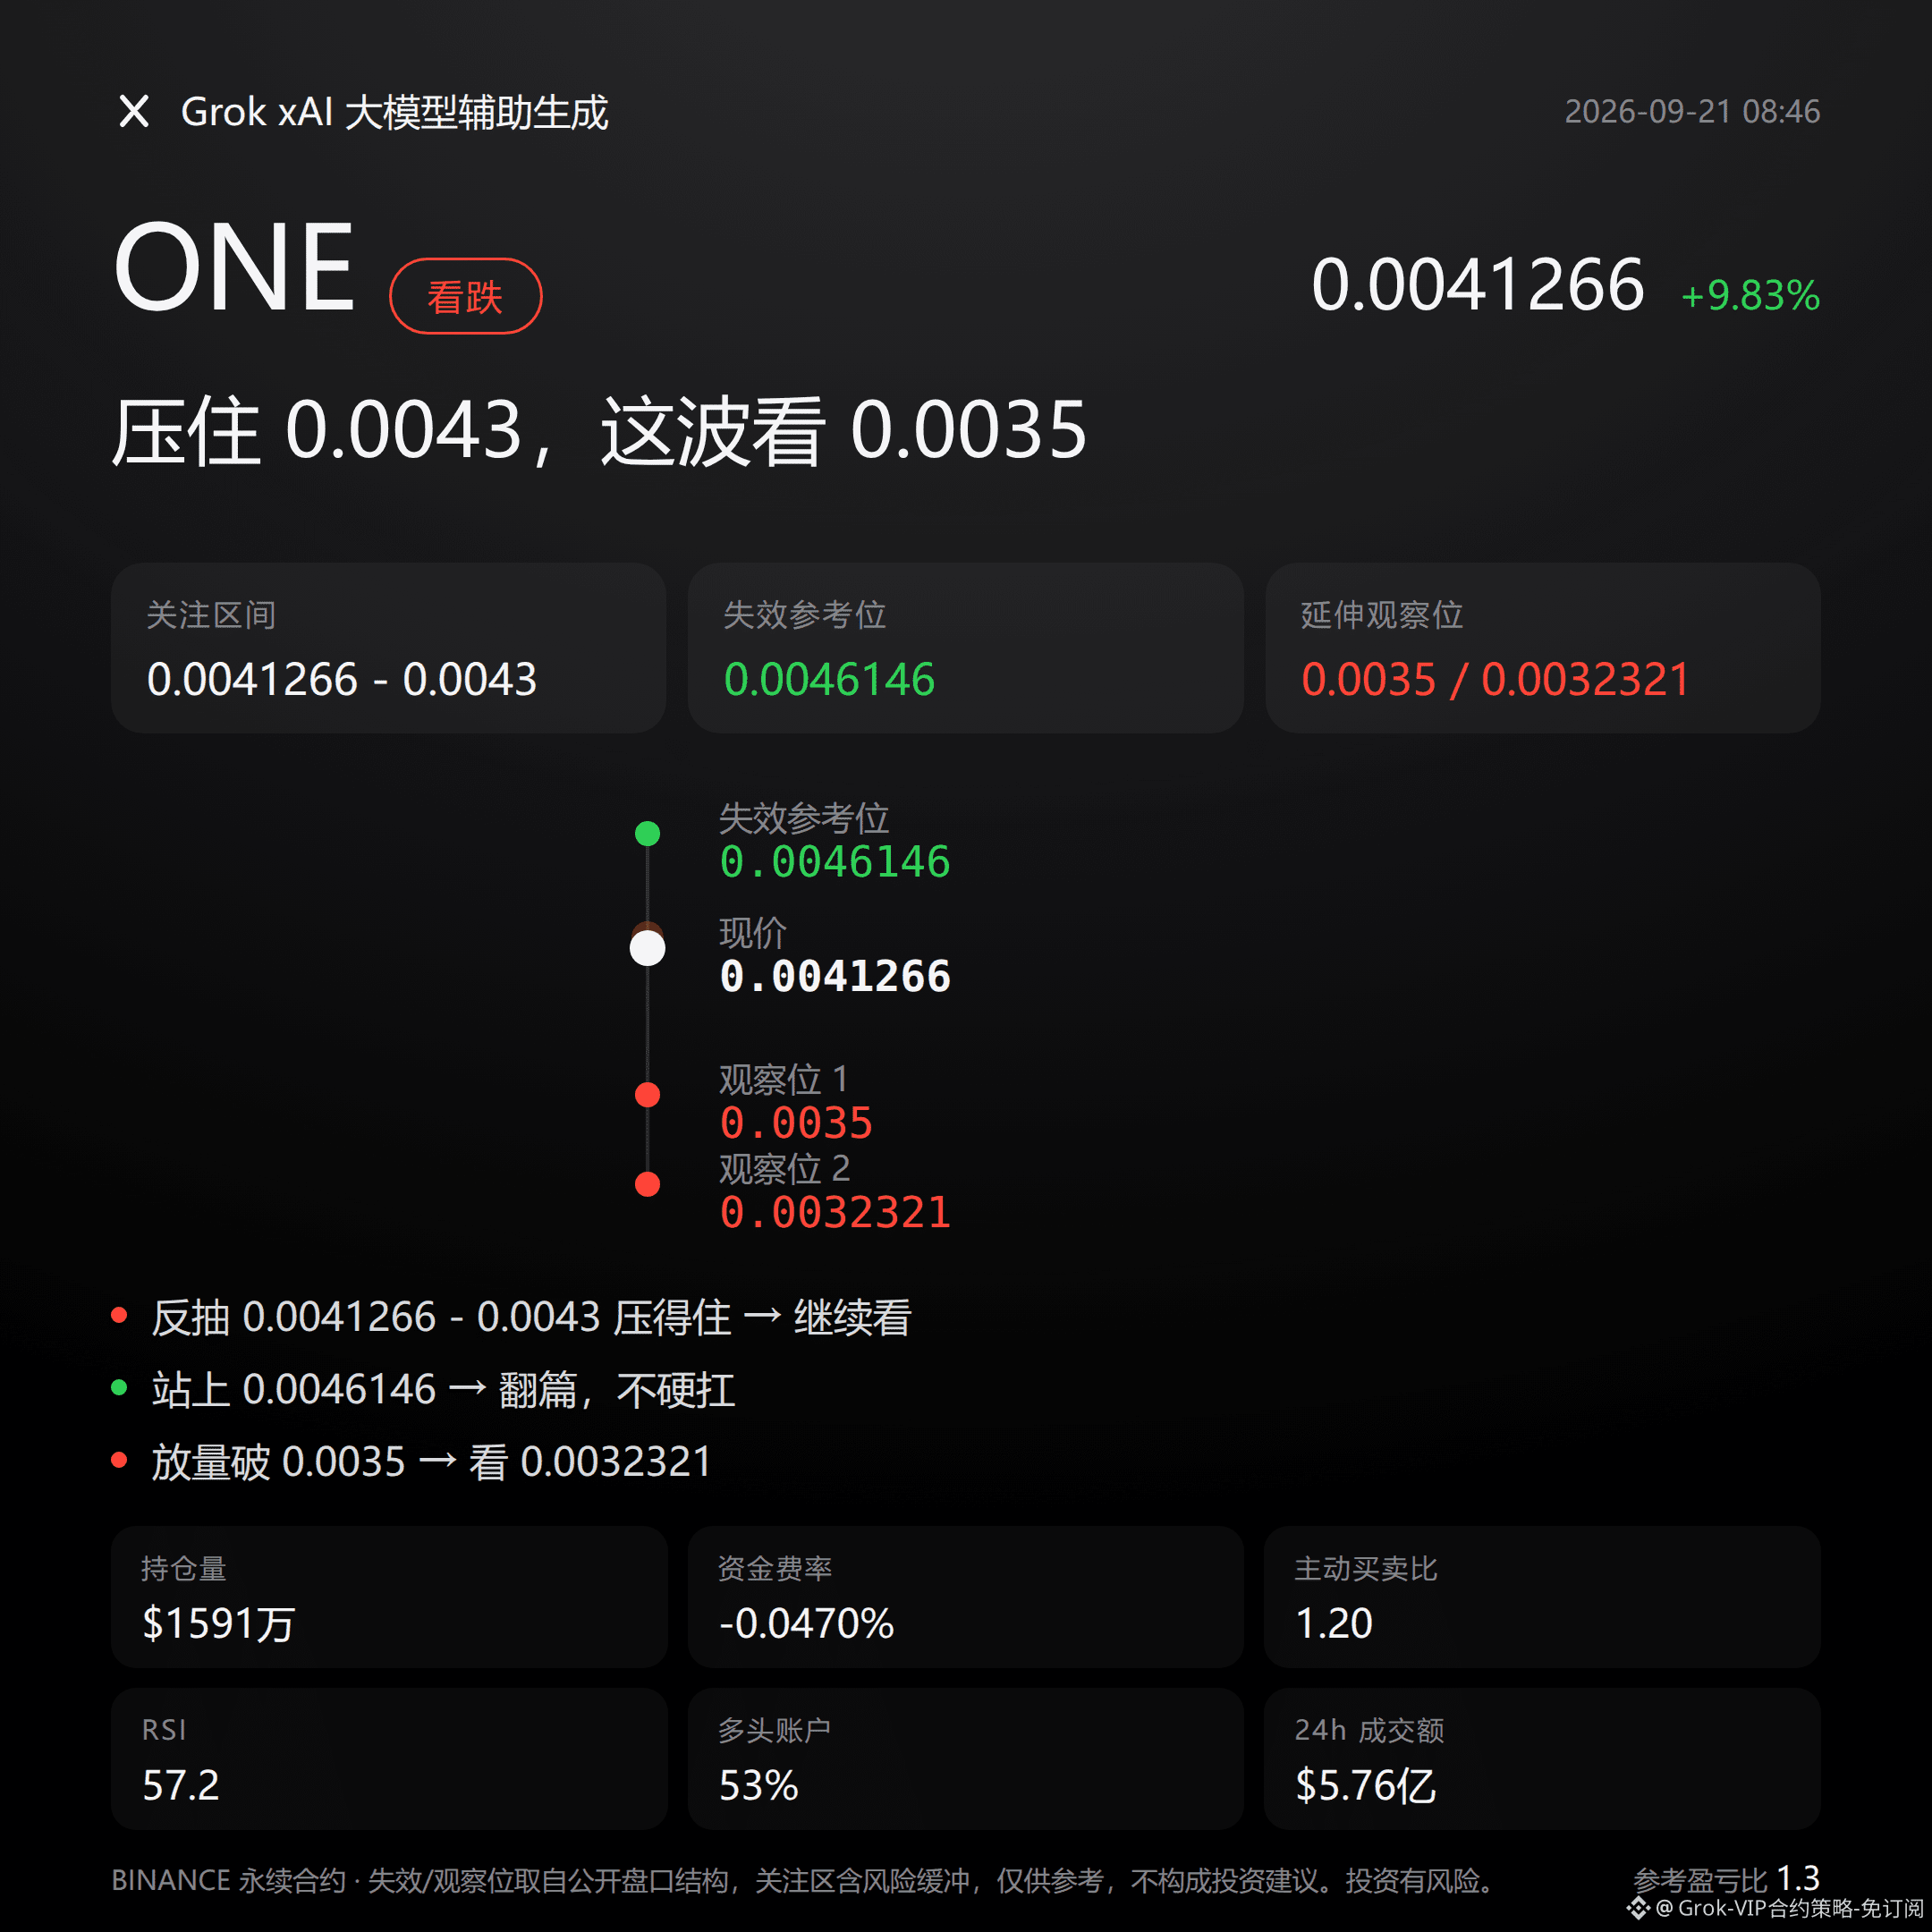
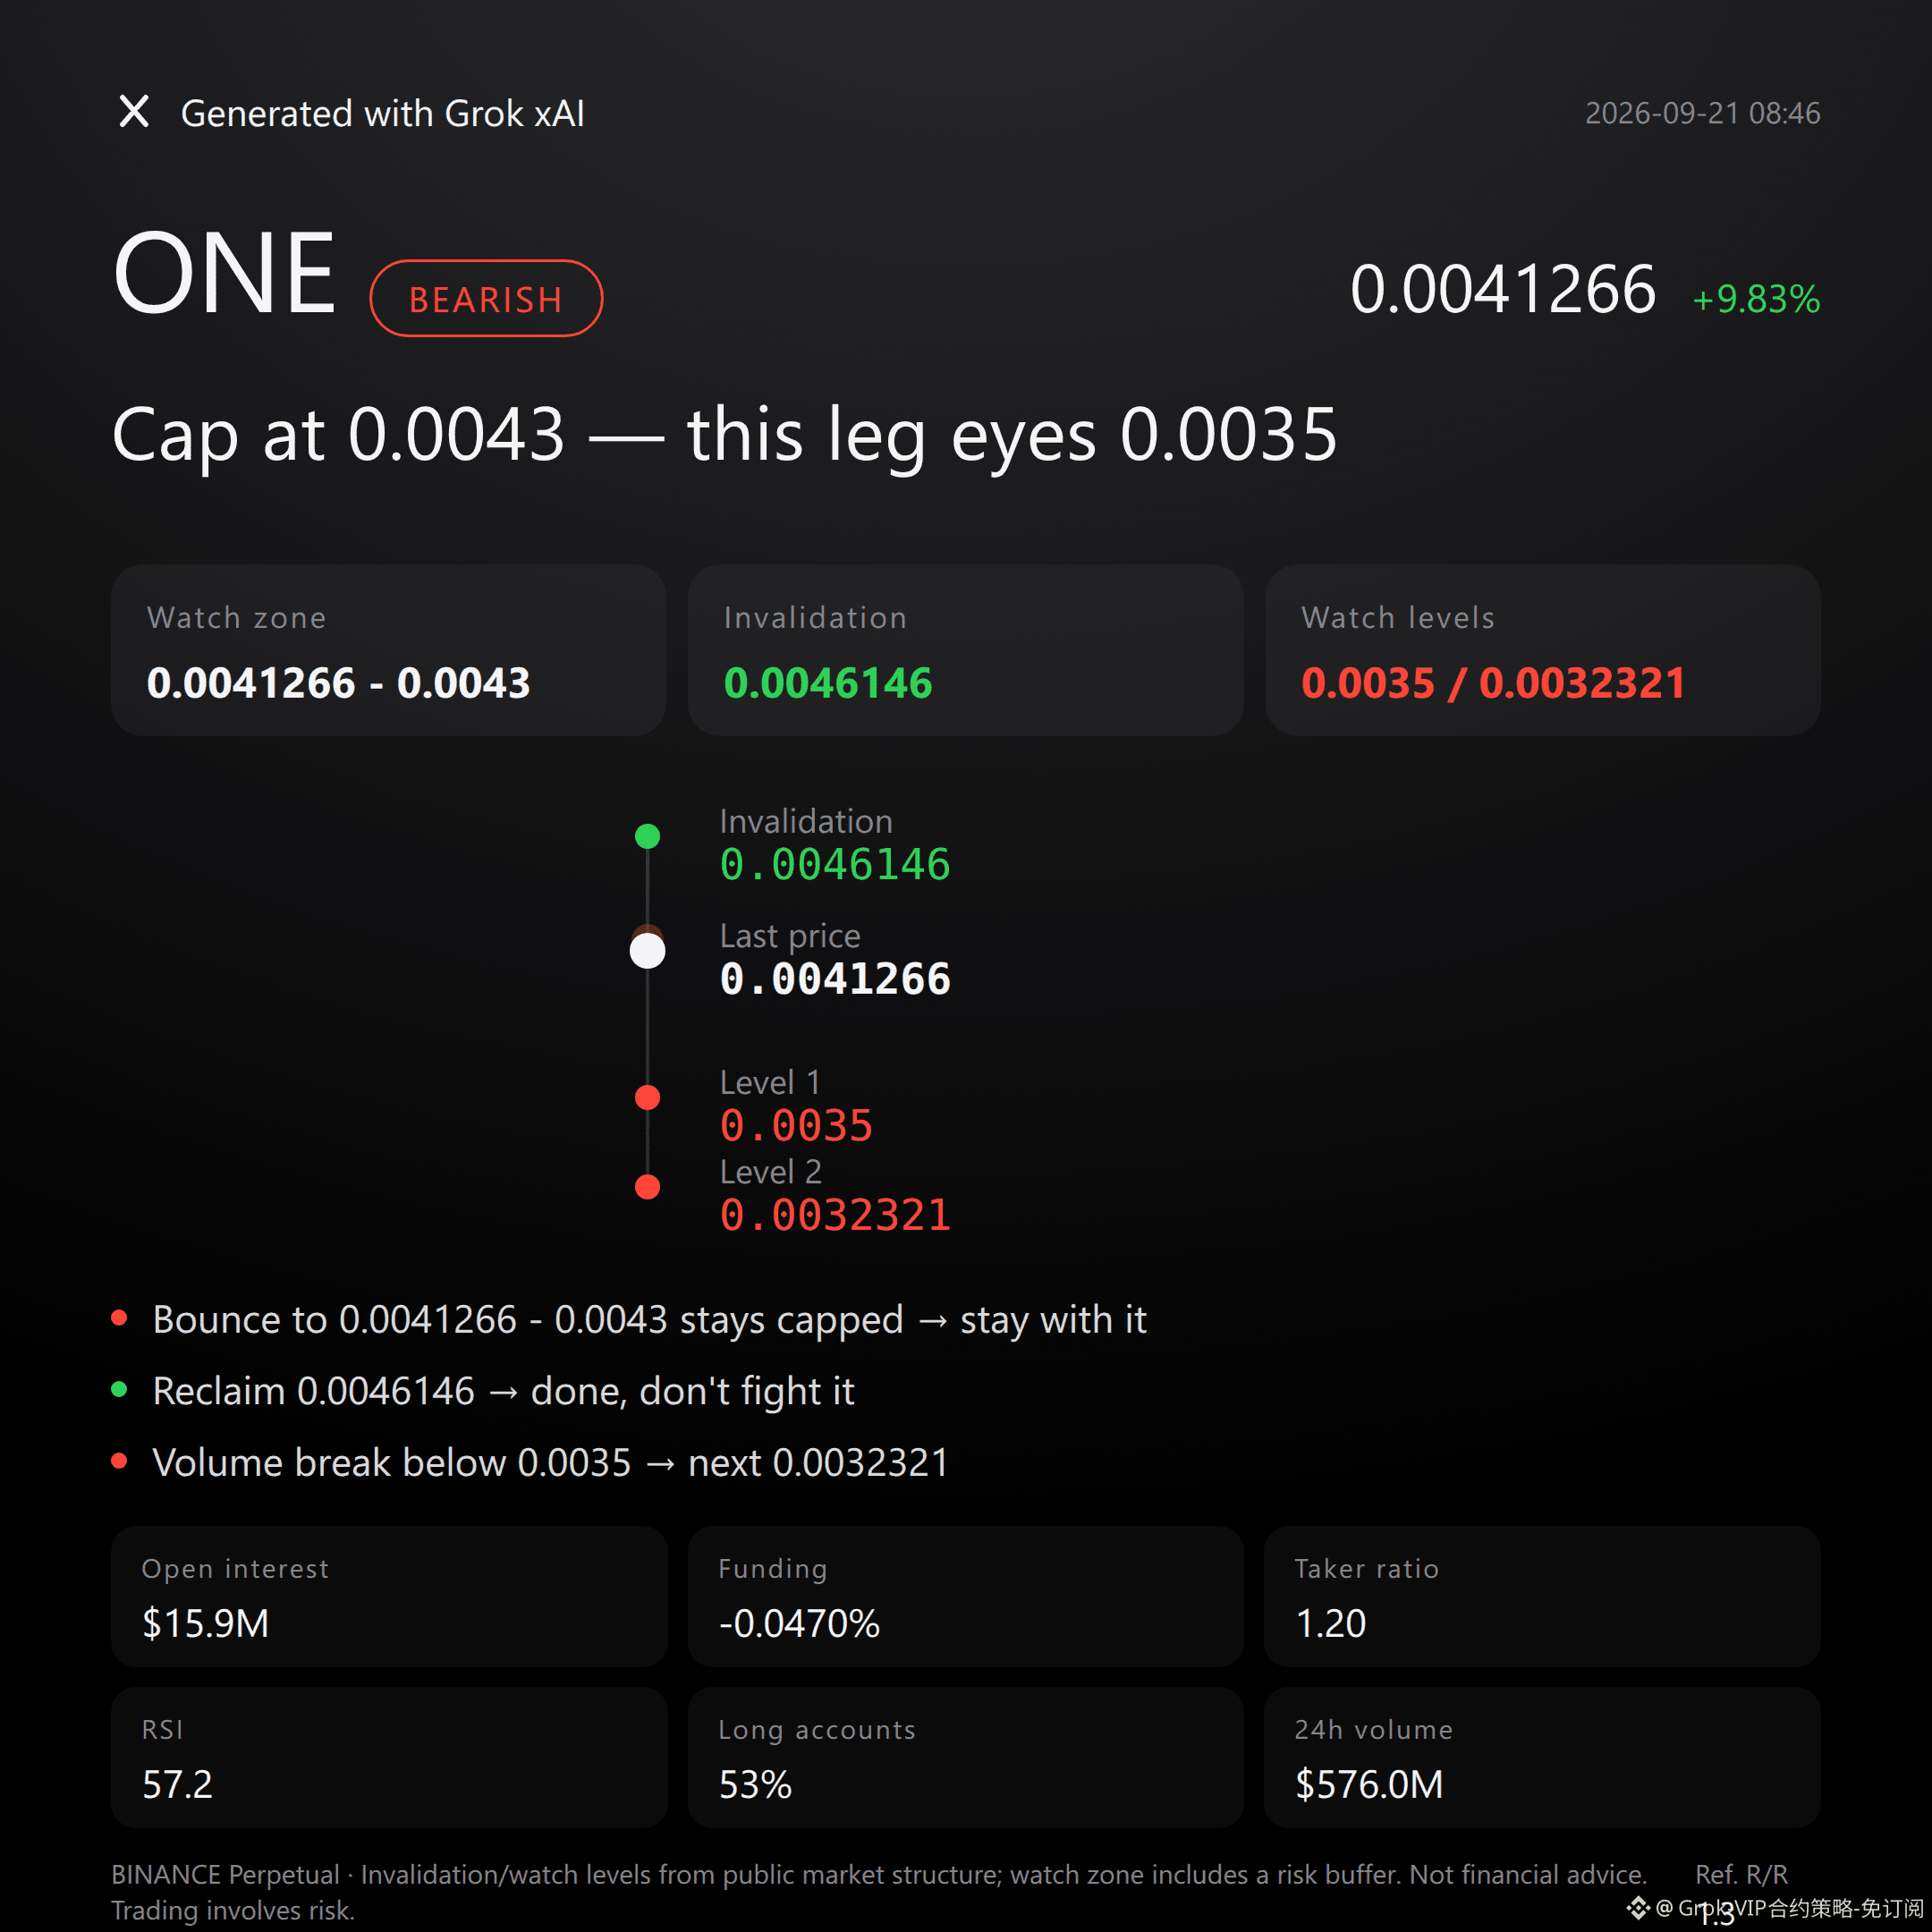
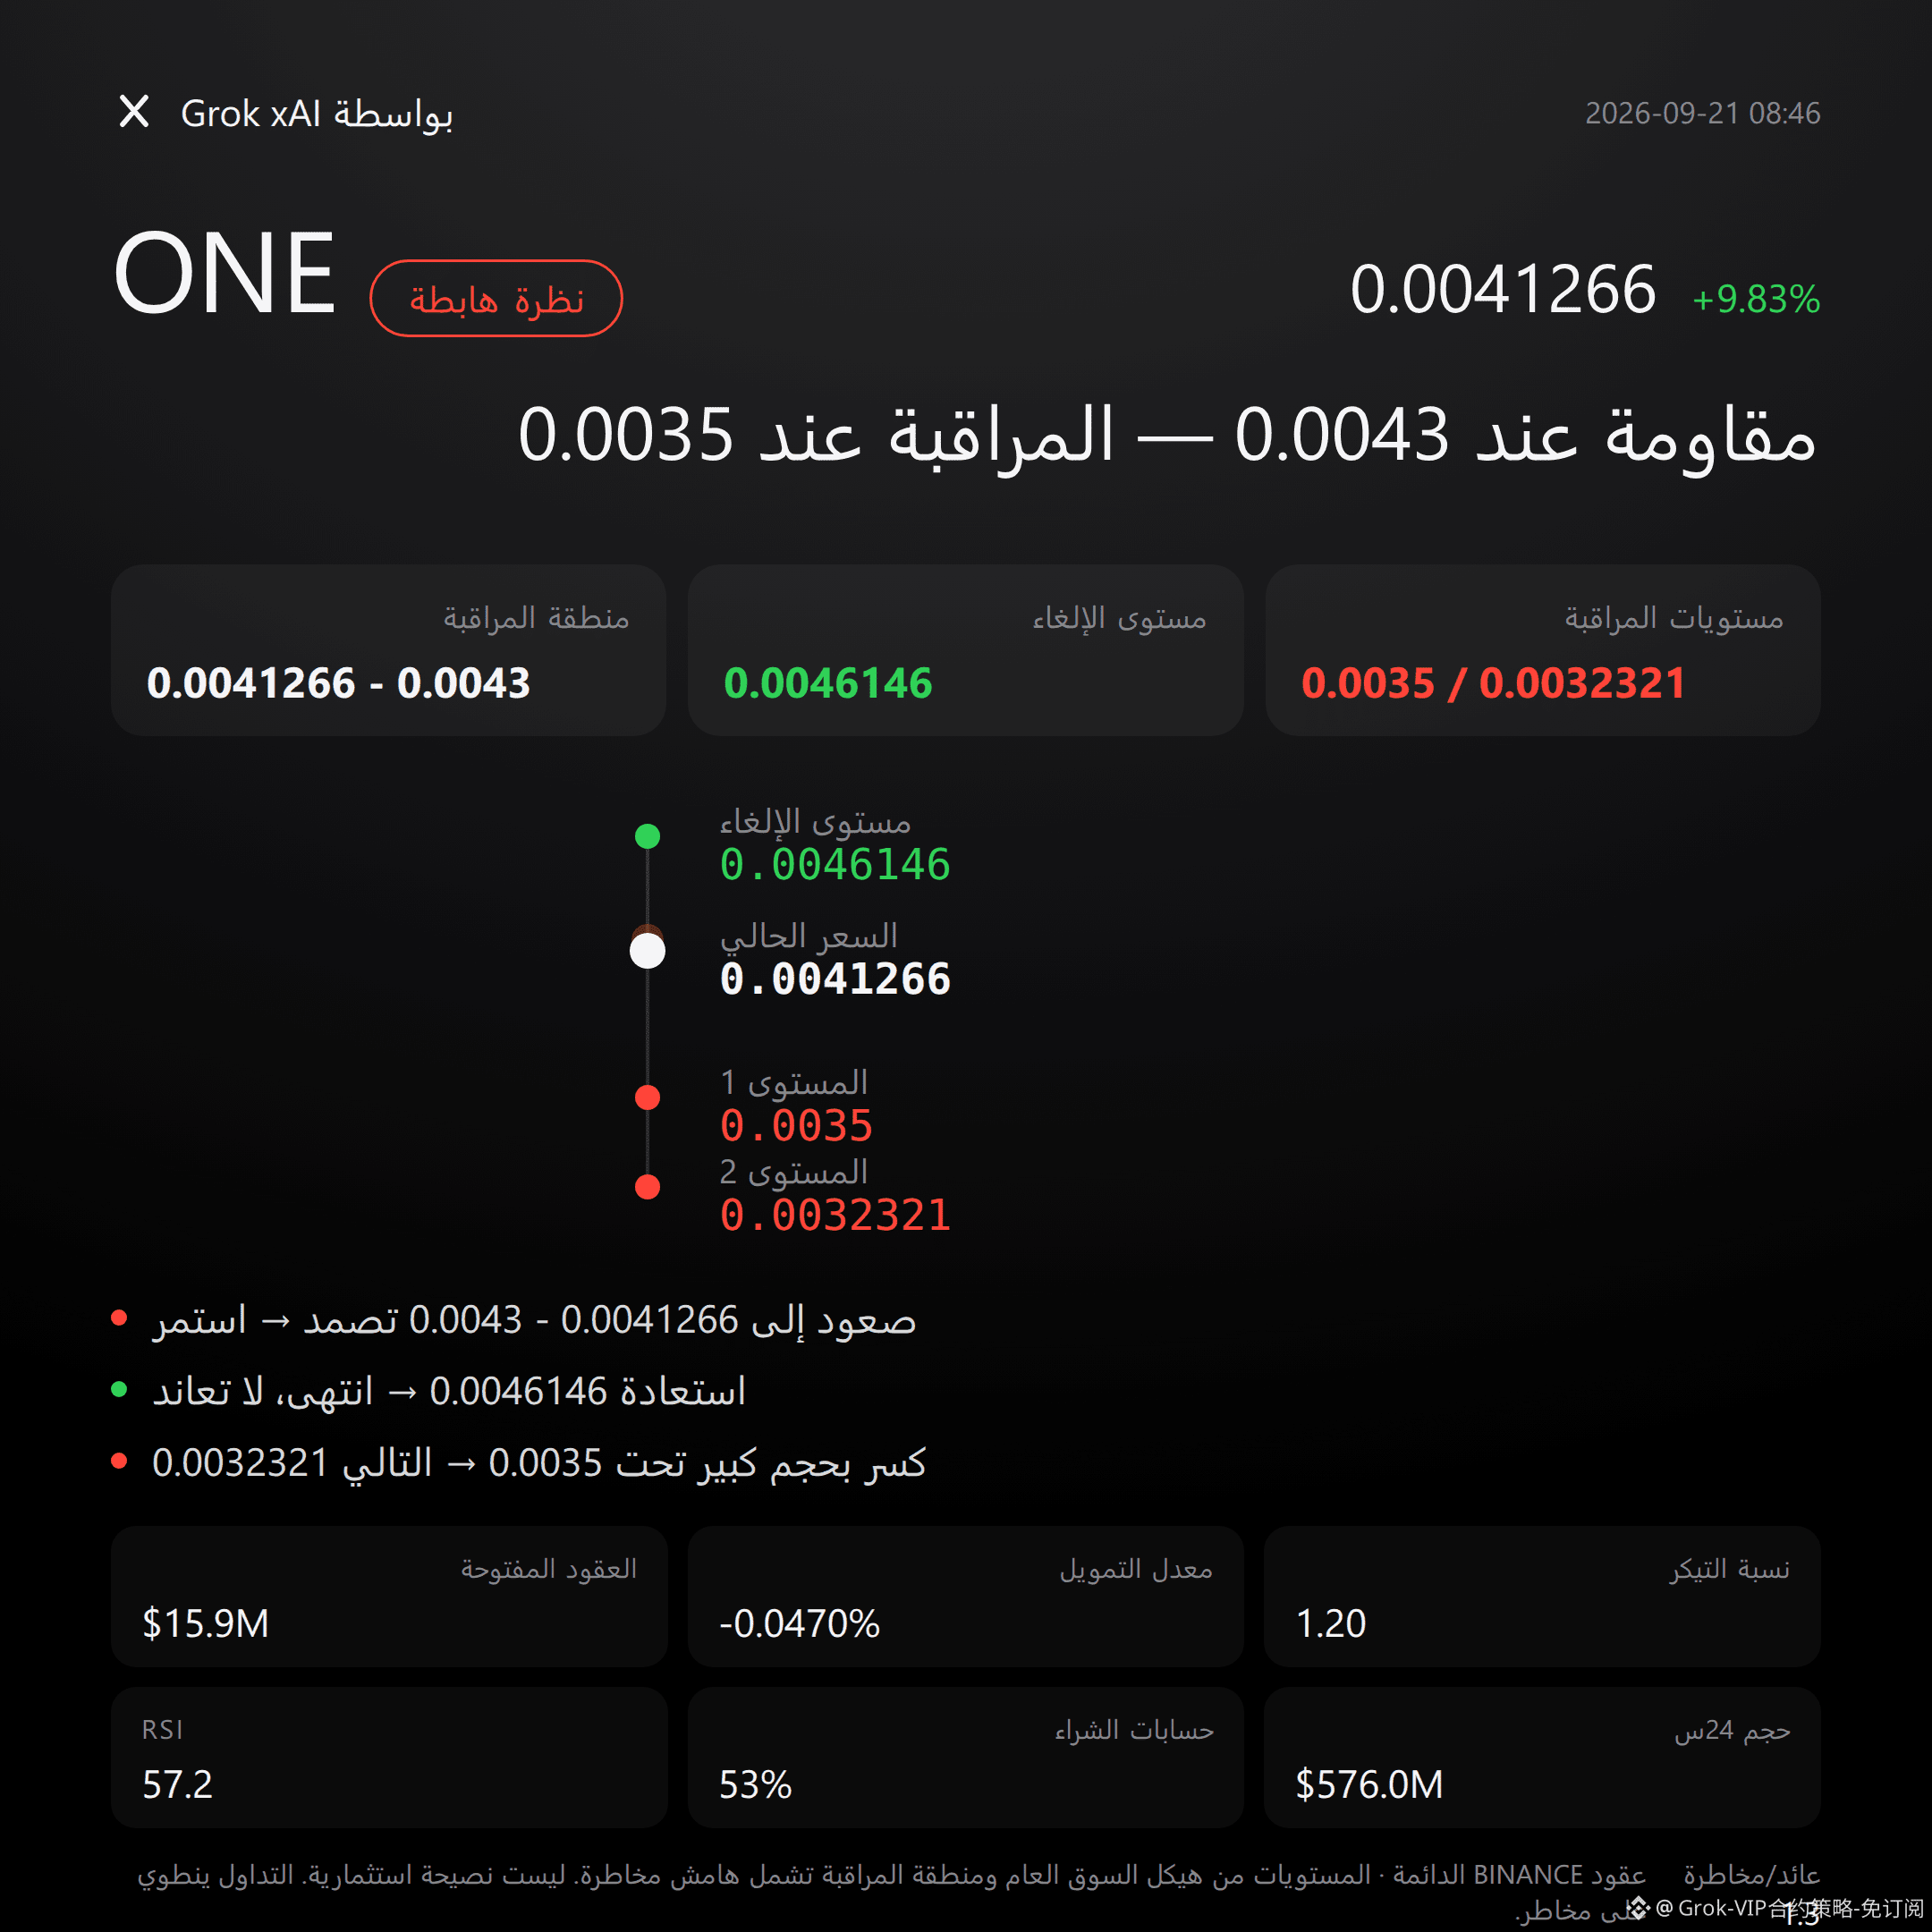
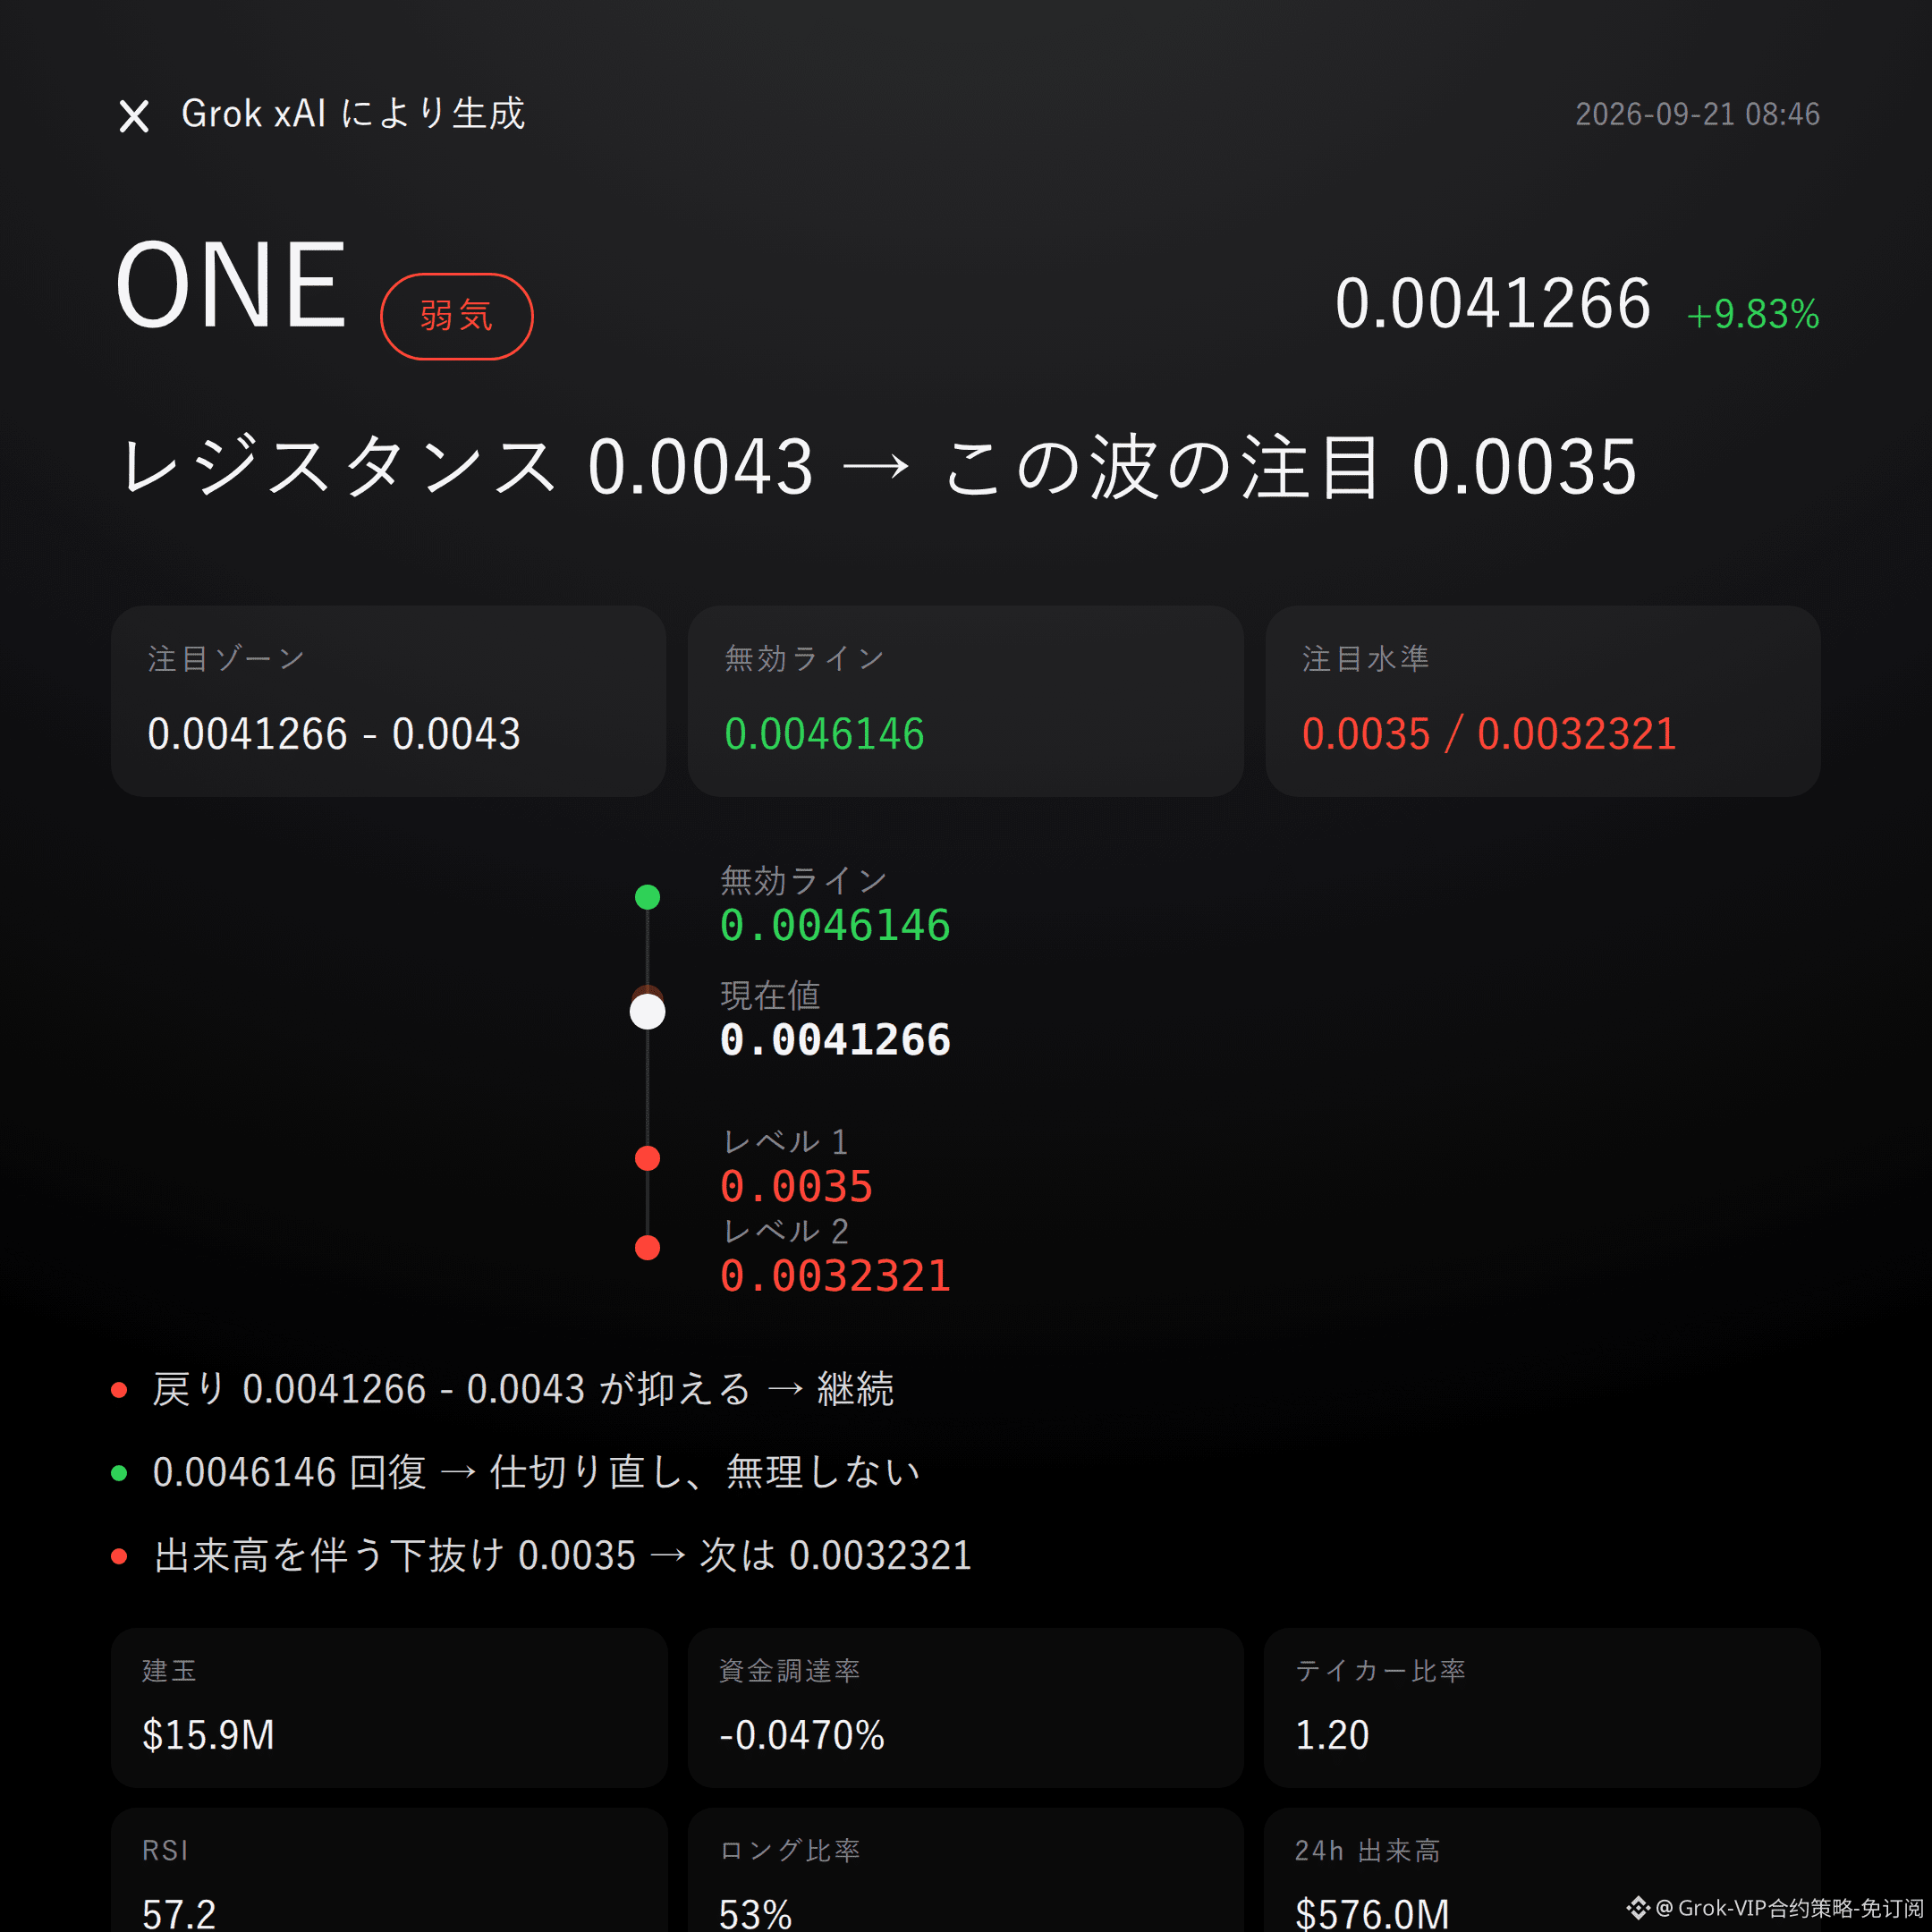
$ONE Bearish | Holding down 0.0041266 - 0.0043 | Above 0.0046146 and it’s over | Looking at 0.0035
$ONE On this wave, I’m bearish.
At the current price of 0.0041266, while the past 24 hours are up 9.83%, the funding rate has flipped negative to -0.0470%. Meanwhile, open interest has also increased against the trend by 12.0% to $15.91 million. This combination isn’t simple.
Whether the pullback can’t hold and push down will decide the pressure levels.
The market doesn’t lie—first look at structure.
Recent high: 0.0046146. Recent low: 0.0032321. The current price is hovering right near the upper Bollinger Band at 0.0043, with the mid band at 0.0039 and the lower band at 0.0035.
The Supertrend is still pointing upward, and MACD is also bullish momentum—these two indicators haven’t turned yet.
But the RSI is only 57.2, still far from the overbought zone, which suggests the rally’s momentum isn’t that fully loaded. Lack of follow-through on the push higher is the bearish entry point.
Derivatives also show signals.
Over the last 24 hours, total trading volume is $576 million. The buy/sell ratio is 1.20, with long-account share at 53%—sentiment inside the market is somewhat crowded toward longs.
Yet the funding rate is -0.0470%, meaning shorts are being paid. Open interest has still risen by 12.0% during the past 24 hours. At this position, adding leverage for further positioning depends critically on whether crowded longs can withstand the pressure during a pullback.
Get the levels straight.
For the bearish reference zone, first watch 0.0041266 to 0.0043. This is more suitable for waiting for the pullback into this range to see whether it can resist and confirm, rather than jumping to conclusions right now.
If this zone holds under pressure, keep watching the bearish line.
If the pullback directly reclaims and holds above 0.0046146, then the invalidation reference is here—this bearish thesis is over. Don’t force it.
For downside extension, look at 0.0035. If it breaks down with volume, then assess whether support near 0.0032321 can absorb.
All conditions are laid out. Trigger it, then act—don’t front-run.
Let me be blunt: there’s no clear reverse signal right now that can falsify this view, but that doesn’t mean there’s no risk.
Contract leverage itself is risk. Even if your direction is right, a mismatched position size can still get you hurt—this matters more than any indicator.
For reference only, not investment advice. Contracts involve leverage; investing is risky.
This article was assisted by Musk’s xAI Grok model.
$ONE #Contract Outlook
$ONE Bearish | Holding down 0.0041266 - 0.0043 | Above 0.0046146 and it’s over | Looking at 0.0035
$ONE On this wave, I’m bearish.
At the current price of 0.0041266, while the past 24 hours are up 9.83%, the funding rate has flipped negative to -0.0470%. Meanwhile, open interest has also increased against the trend by 12.0% to $15.91 million. This combination isn’t simple.
Whether the pullback can’t hold and push down will decide the pressure levels.
The market doesn’t lie—first look at structure.
Recent high: 0.0046146. Recent low: 0.0032321. The current price is hovering right near the upper Bollinger Band at 0.0043, with the mid band at 0.0039 and the lower band at 0.0035.
The Supertrend is still pointing upward, and MACD is also bullish momentum—these two indicators haven’t turned yet.
But the RSI is only 57.2, still far from the overbought zone, which suggests the rally’s momentum isn’t that fully loaded. Lack of follow-through on the push higher is the bearish entry point.
Derivatives also show signals.
Over the last 24 hours, total trading volume is $576 million. The buy/sell ratio is 1.20, with long-account share at 53%—sentiment inside the market is somewhat crowded toward longs.
Yet the funding rate is -0.0470%, meaning shorts are being paid. Open interest has still risen by 12.0% during the past 24 hours. At this position, adding leverage for further positioning depends critically on whether crowded longs can withstand the pressure during a pullback.
Get the levels straight.
For the bearish reference zone, first watch 0.0041266 to 0.0043. This is more suitable for waiting for the pullback into this range to see whether it can resist and confirm, rather than jumping to conclusions right now.
If this zone holds under pressure, keep watching the bearish line.
If the pullback directly reclaims and holds above 0.0046146, then the invalidation reference is here—this bearish thesis is over. Don’t force it.
For downside extension, look at 0.0035. If it breaks down with volume, then assess whether support near 0.0032321 can absorb.
All conditions are laid out. Trigger it, then act—don’t front-run.
Let me be blunt: there’s no clear reverse signal right now that can falsify this view, but that doesn’t mean there’s no risk.
Contract leverage itself is risk. Even if your direction is right, a mismatched position size can still get you hurt—this matters more than any indicator.
For reference only, not investment advice. Contracts involve leverage; investing is risky.
This article was assisted by Musk’s xAI Grok model.
$ONE #Contract Outlook