Monitor AVAX price fluctuation and technical zones
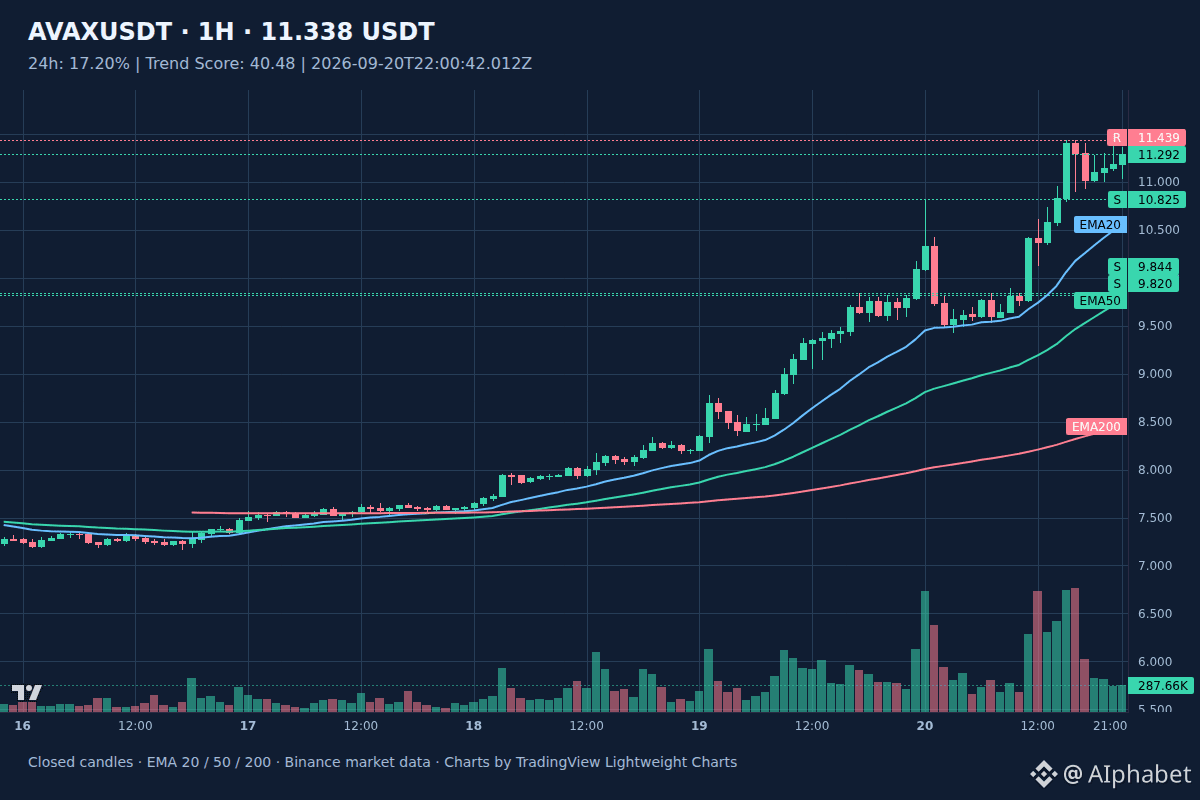
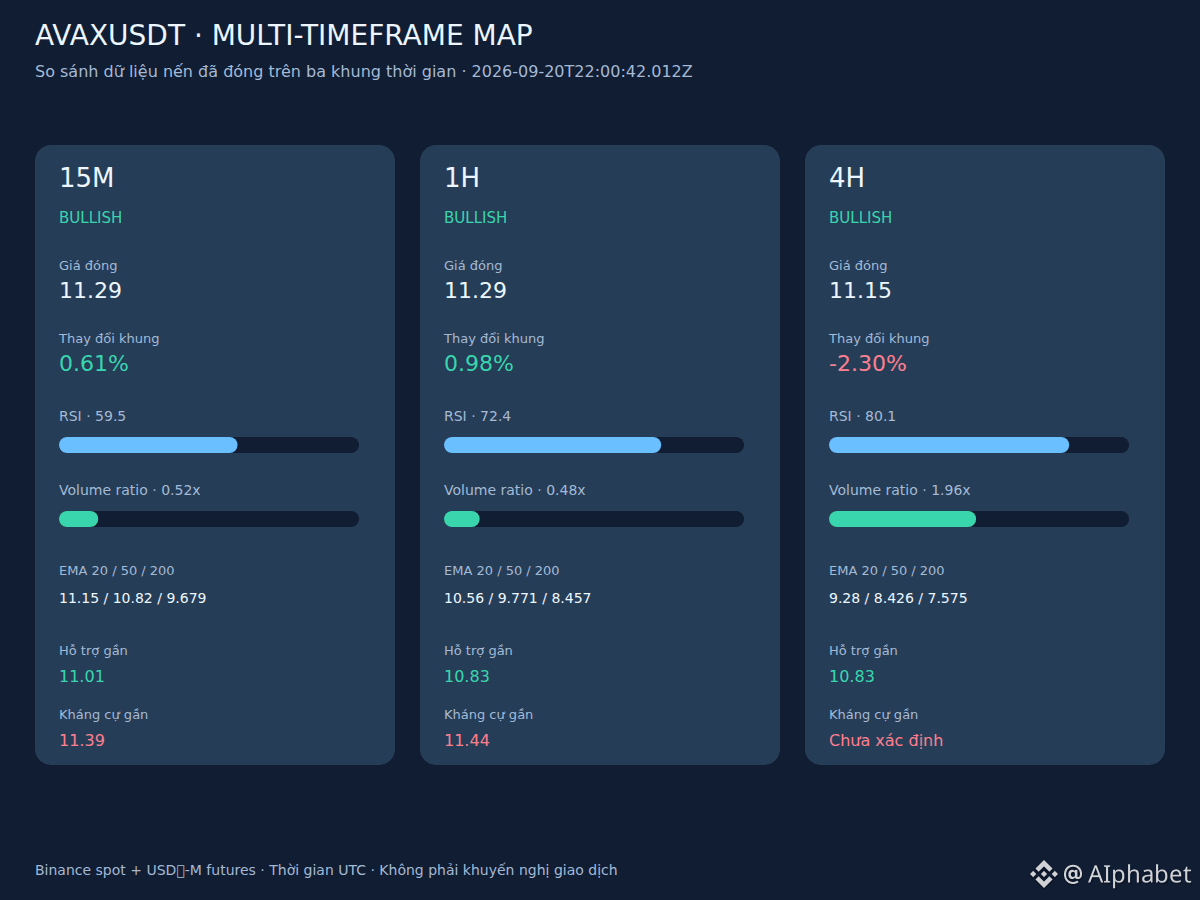
The market is recording a 17.20% growth rate, with the 4-hour RSI index reaching 80.1, forming key validation areas for the next leg. The chart shows the price is above the moving average lines, with the nearest support around 10.825 on the 1-hour timeframe. The resistance zone at 11.439 will be the challenge to watch in order to determine the likelihood of a continued uptrend.
↑ If buying pressure continues to hold and breaks above resistance 11.439 on the 1-hour timeframe, the price may move toward higher zones—like a tornado sweeping along with the flow of incoming capital.
↓ Conversely, if profit-taking pressure increases and causes the price to break below support 10.825, the market risks retreating to lower price zones to find a new balance point.
Pay close attention to the 10.825 level because losing this support may break the short-term bullish structure.
#Crypto #AVAX
The market is recording a 17.20% growth rate, with the 4-hour RSI index reaching 80.1, forming key validation areas for the next leg. The chart shows the price is above the moving average lines, with the nearest support around 10.825 on the 1-hour timeframe. The resistance zone at 11.439 will be the challenge to watch in order to determine the likelihood of a continued uptrend.
↑ If buying pressure continues to hold and breaks above resistance 11.439 on the 1-hour timeframe, the price may move toward higher zones—like a tornado sweeping along with the flow of incoming capital.
↓ Conversely, if profit-taking pressure increases and causes the price to break below support 10.825, the market risks retreating to lower price zones to find a new balance point.
Pay close attention to the 10.825 level because losing this support may break the short-term bullish structure.
#Crypto #AVAX