🚨 ROSE/USDT : Is the trap closing on the Longs? On-chain data analysis!
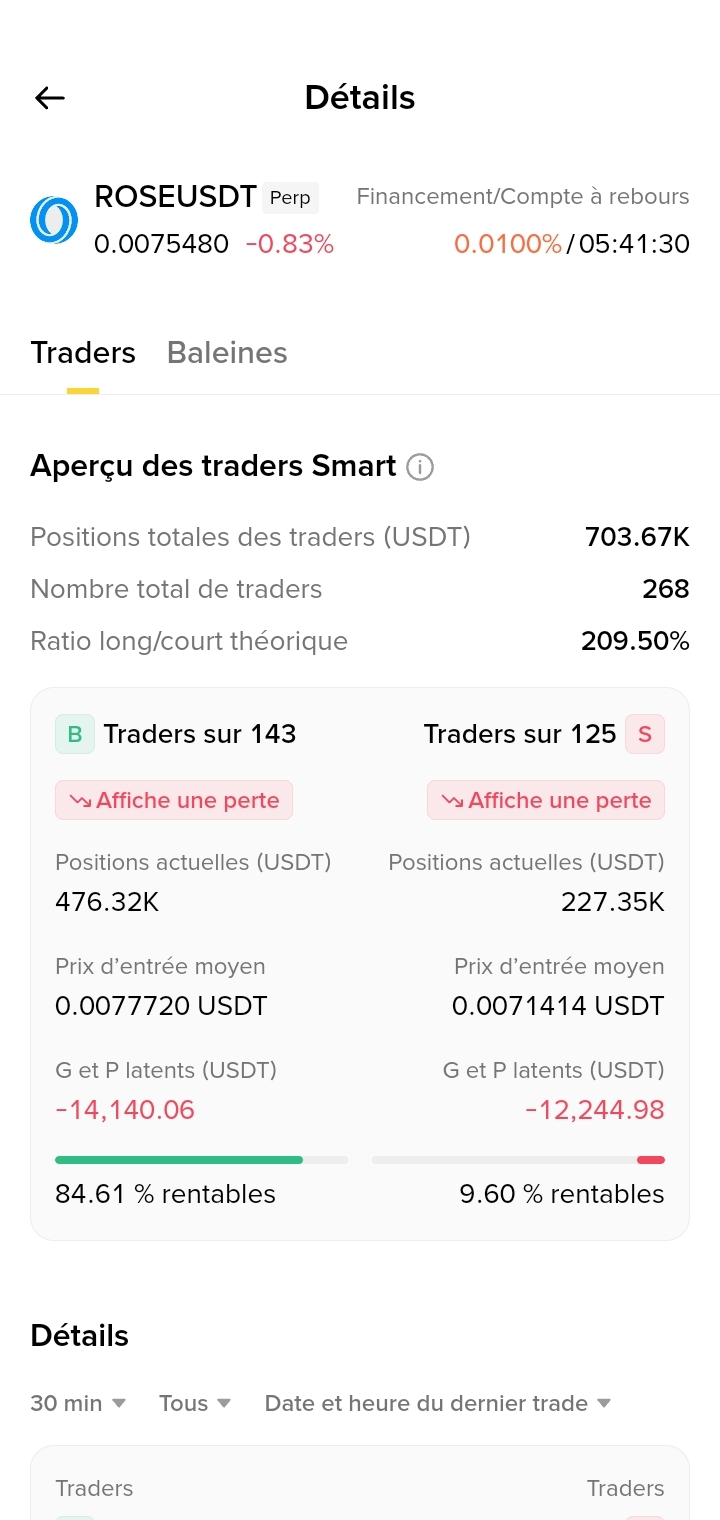
Friends, let’s face the truth about $ROSE. Technical analysis is one thing, but sentiment and flow (Order Flow) data is telling a much darker story for buyers right now. 📉
Here’s why a massive liquidation of the Longs is a very serious possibility:
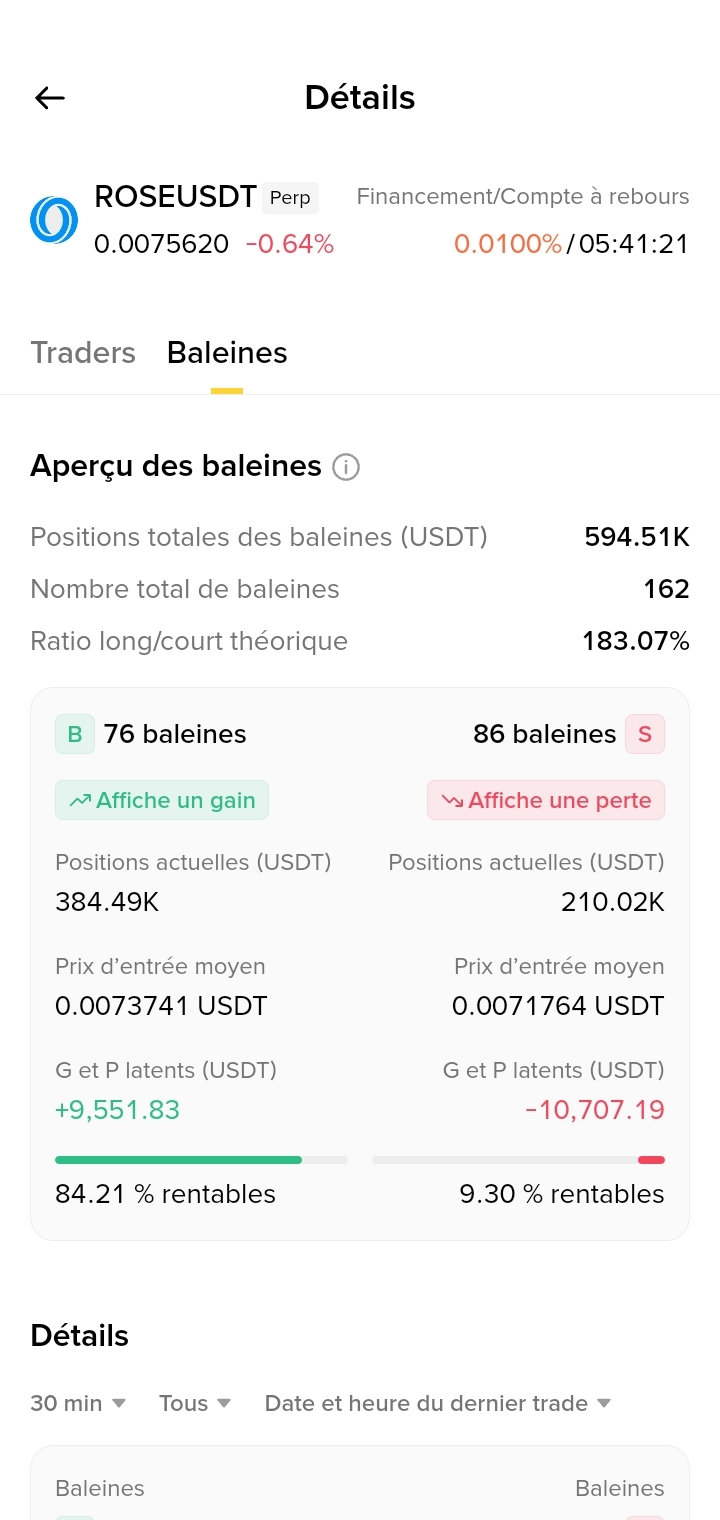
1️⃣ Whales have chosen their side 🐋 : Look at the “Whales” chart. Out of 162 whales, 86 are Short versus only 76 Long. Their Short positions are currently in the red, but they’re holding strong. If the price breaks, they’ll be the first to accelerate the drop.
2️⃣ The Long/Short ratio is collapsing : The overall ratio is in freefall (down from 1.90 to 1.73). Traders are closing their Longs and flipping to Short. Sentiment is changing radically.
3️⃣ Selling pressure is real : The Taker Volume shows spikes of aggressive selling (red bars) clearly higher than buying. Sellers control the order book.
4️⃣ Open Interest is dropping : The yellow chart shows that Long positions are being liquidated or closed. Buying pressure is evaporating.
⚠️ The possible scenario :
The price is currently stuck in a consolidation zone (the green rectangle on my chart). IF support at 0,007489 breaks under selling pressure, we could see a domino effect. Long stop-losses would trigger in cascade, which could push the price violently lower (toward 0,007305 and beyond).
👉 What to watch closely : A breakdown from the bottom of this range with a large volume of selling. This is the signal that the whales are waiting to trap the last buyers.
This is not financial advice. Manage your risk!
Friends, let’s face the truth about $ROSE. Technical analysis is one thing, but sentiment and flow (Order Flow) data is telling a much darker story for buyers right now. 📉
Here’s why a massive liquidation of the Longs is a very serious possibility:
1️⃣ Whales have chosen their side 🐋 : Look at the “Whales” chart. Out of 162 whales, 86 are Short versus only 76 Long. Their Short positions are currently in the red, but they’re holding strong. If the price breaks, they’ll be the first to accelerate the drop.
2️⃣ The Long/Short ratio is collapsing : The overall ratio is in freefall (down from 1.90 to 1.73). Traders are closing their Longs and flipping to Short. Sentiment is changing radically.
3️⃣ Selling pressure is real : The Taker Volume shows spikes of aggressive selling (red bars) clearly higher than buying. Sellers control the order book.
4️⃣ Open Interest is dropping : The yellow chart shows that Long positions are being liquidated or closed. Buying pressure is evaporating.
⚠️ The possible scenario :
The price is currently stuck in a consolidation zone (the green rectangle on my chart). IF support at 0,007489 breaks under selling pressure, we could see a domino effect. Long stop-losses would trigger in cascade, which could push the price violently lower (toward 0,007305 and beyond).
👉 What to watch closely : A breakdown from the bottom of this range with a large volume of selling. This is the signal that the whales are waiting to trap the last buyers.
This is not financial advice. Manage your risk!