$G /USDT — Gravity AI Analysis
Current price: $0.00689
24h change: -29.12%
24h high: $0.01513
24h low: $0.00655
24h volume: 7.12B G / $68.46M USDT
Key levels
Immediate support: $0.00655
Next support: $0.00612
Resistance: $0.00801
Major resistance: $0.00990
Higher resistance: $0.01178
Strong resistance: $0.01367–$0.01513
What the chart shows
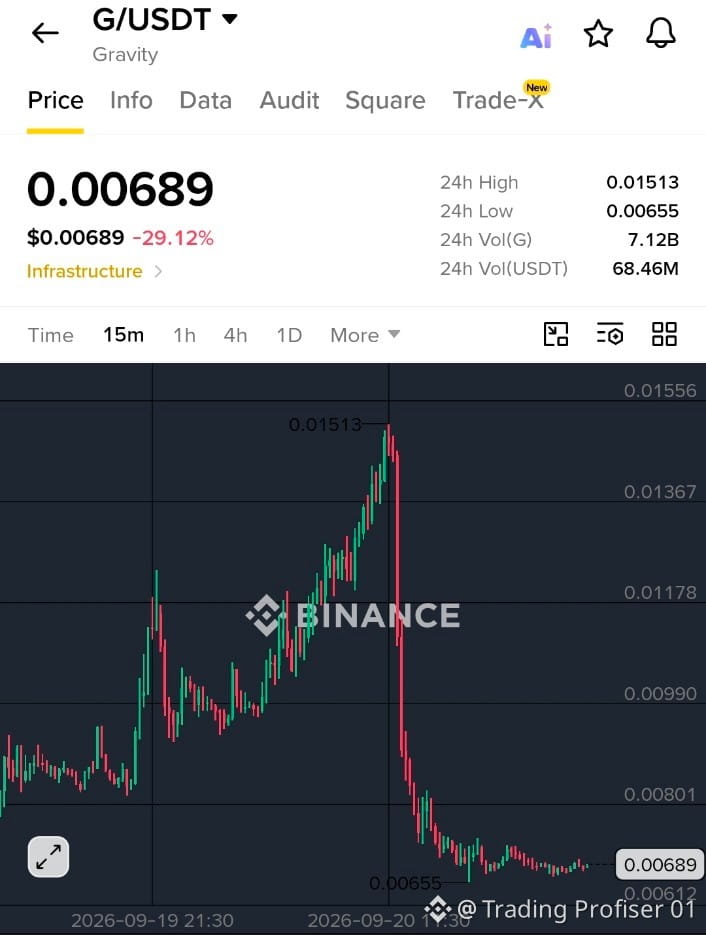
The price has fallen sharply from around $0.01513 to $0.00689, so the short-term trend is strongly bearish.
The important area now is $0.00655–$0.00612. If $0.00655 holds and buying volume appears, a rebound toward $0.00801 is possible. A break above $0.00801 could open the way toward $0.00990.
However, if $0.00655 breaks decisively, the next level to watch is around $0.00612.
Short-term: Bearish until the price recovers above $0.00801.
Potential rebound levels: $0.00801 → $0.00990 → $0.01178.
Main downside levels: $0.00655 → $0.00612.
This is technical analysis, not a guarantee of future price movement.
Current price: $0.00689
24h change: -29.12%
24h high: $0.01513
24h low: $0.00655
24h volume: 7.12B G / $68.46M USDT
Key levels
Immediate support: $0.00655
Next support: $0.00612
Resistance: $0.00801
Major resistance: $0.00990
Higher resistance: $0.01178
Strong resistance: $0.01367–$0.01513
What the chart shows
The price has fallen sharply from around $0.01513 to $0.00689, so the short-term trend is strongly bearish.
The important area now is $0.00655–$0.00612. If $0.00655 holds and buying volume appears, a rebound toward $0.00801 is possible. A break above $0.00801 could open the way toward $0.00990.
However, if $0.00655 breaks decisively, the next level to watch is around $0.00612.
Short-term: Bearish until the price recovers above $0.00801.
Potential rebound levels: $0.00801 → $0.00990 → $0.01178.
Main downside levels: $0.00655 → $0.00612.
This is technical analysis, not a guarantee of future price movement.