🚨 $AKE Chart Analysis: Classic Pump & Dump or a Chance for Recovery? 📊
Today, we took a detailed look at the metrics and price action of the AKE token (AKE/WBNB). In short—we are looking at a textbook manipulative scheme, and here’s why:
💥 What happened to the price?
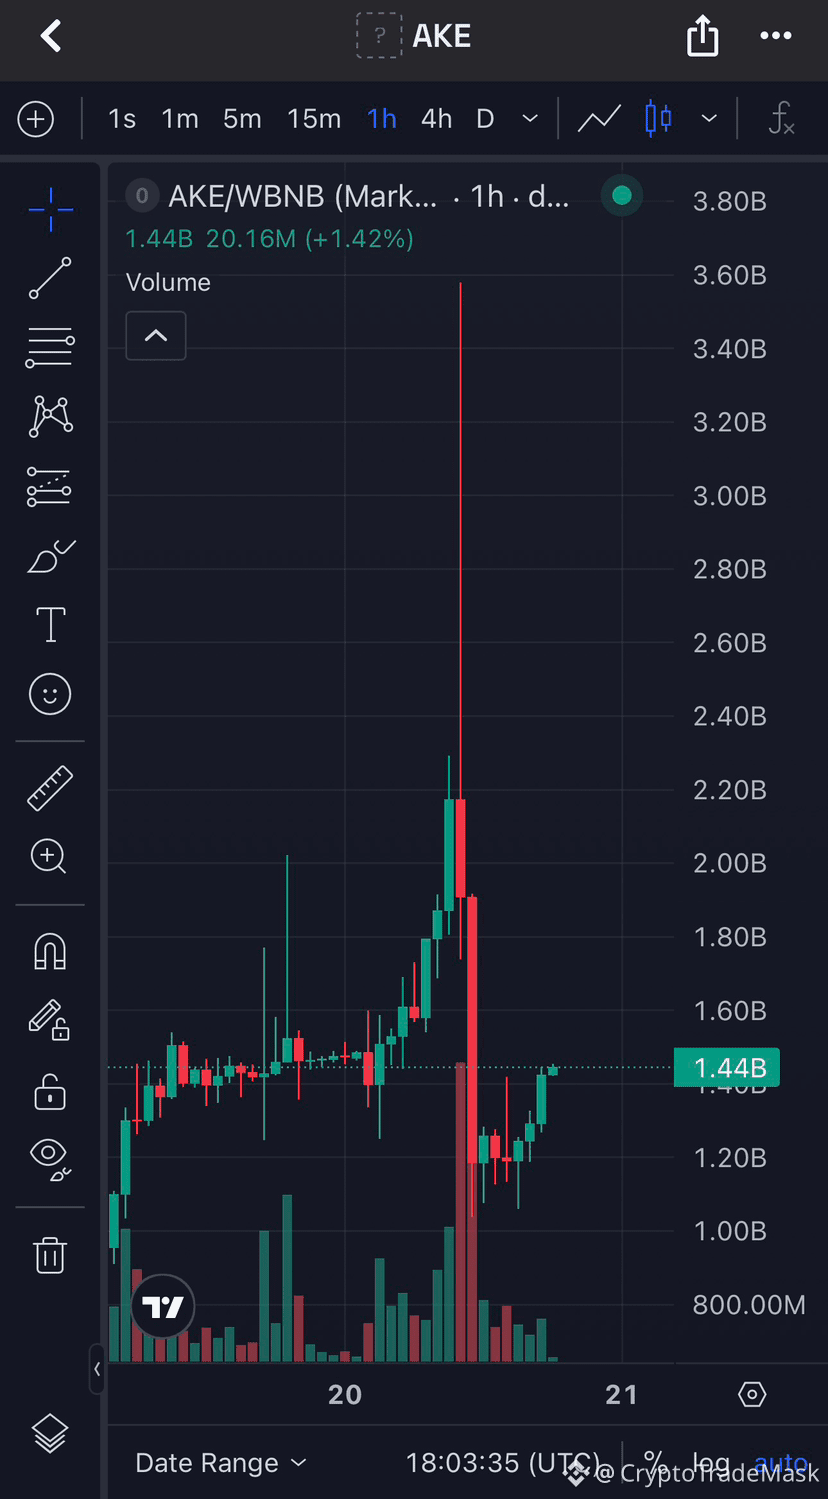
Rapid Pump: The price was pushed from a baseline zone of $1.20B–$1.50B to a peak of $3.60B in just a single one-hour candle.
Panic Dump: A long upper wick formed at the peak, followed by an immediate price collapse back to the initial $1.30B–$1.44B range.
💰 What are insiders and insider wallets doing?
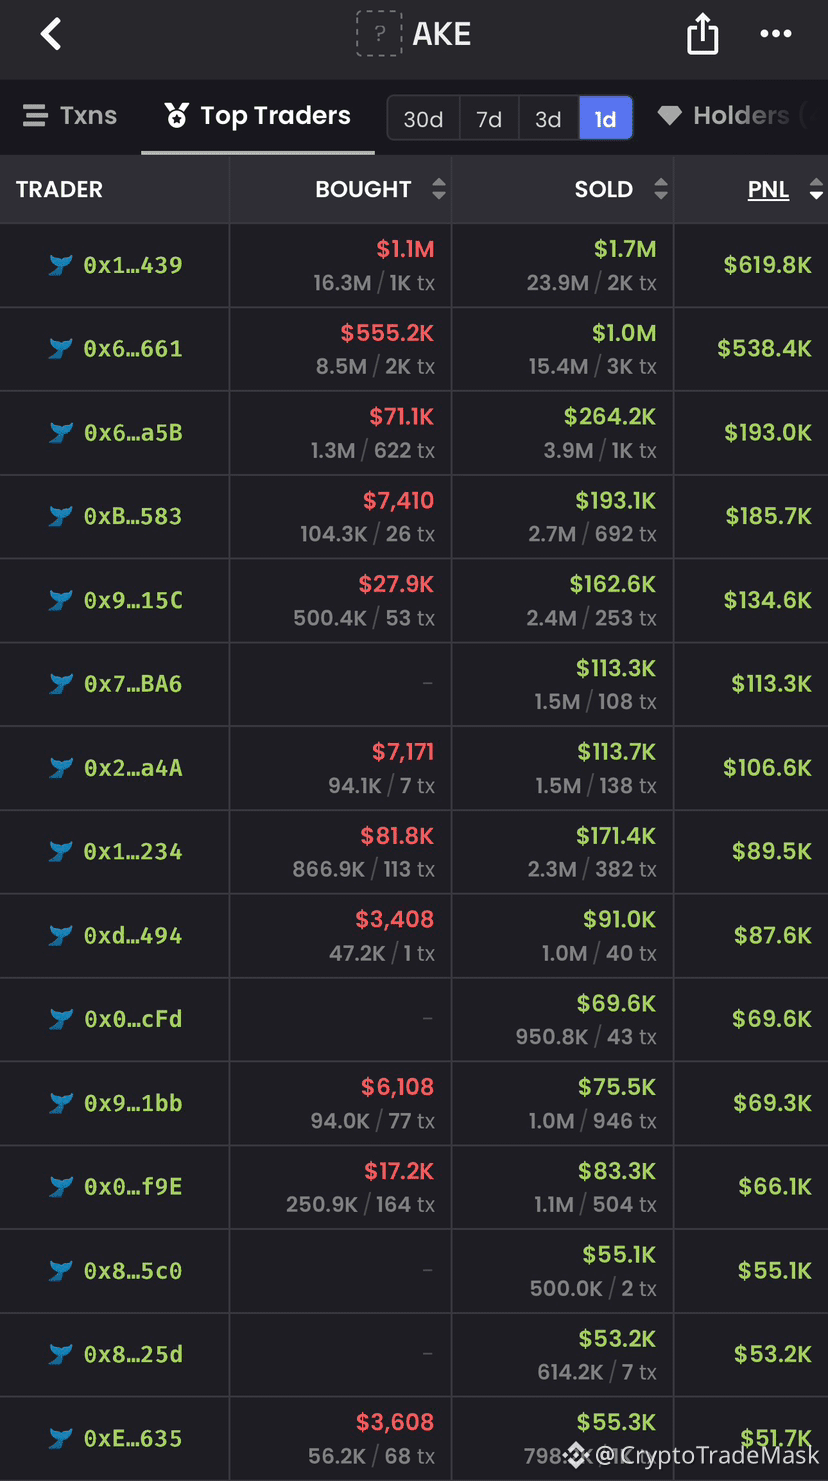
Top Traders Locking in Millions: Top addresses dumped tokens en masse at the peak. For instance, wallet 0x1...439 realized a profit of +$619.8K, while 0x6...661 made +$538.4K.
One-Sided Selling: Some top traders didn't buy the token at all during this move; instead, they simply offloaded previously accumulated holdings onto retail buyers driven by FOMO.
🕸 What does on-chain analysis (Holders & Bubblemaps) reveal?
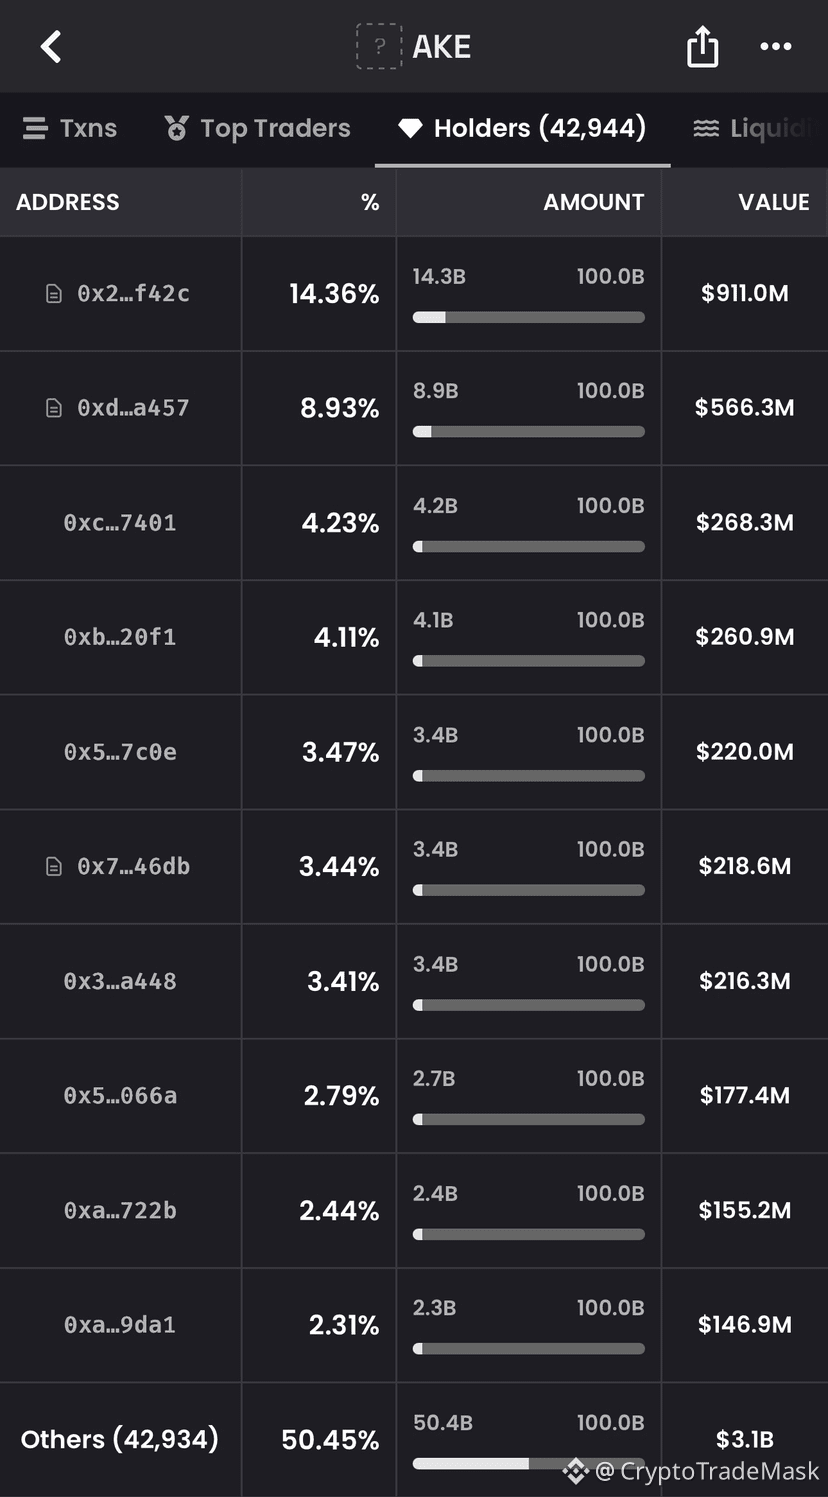
Concentration: The top 10 wallets control about 50% of the total supply.
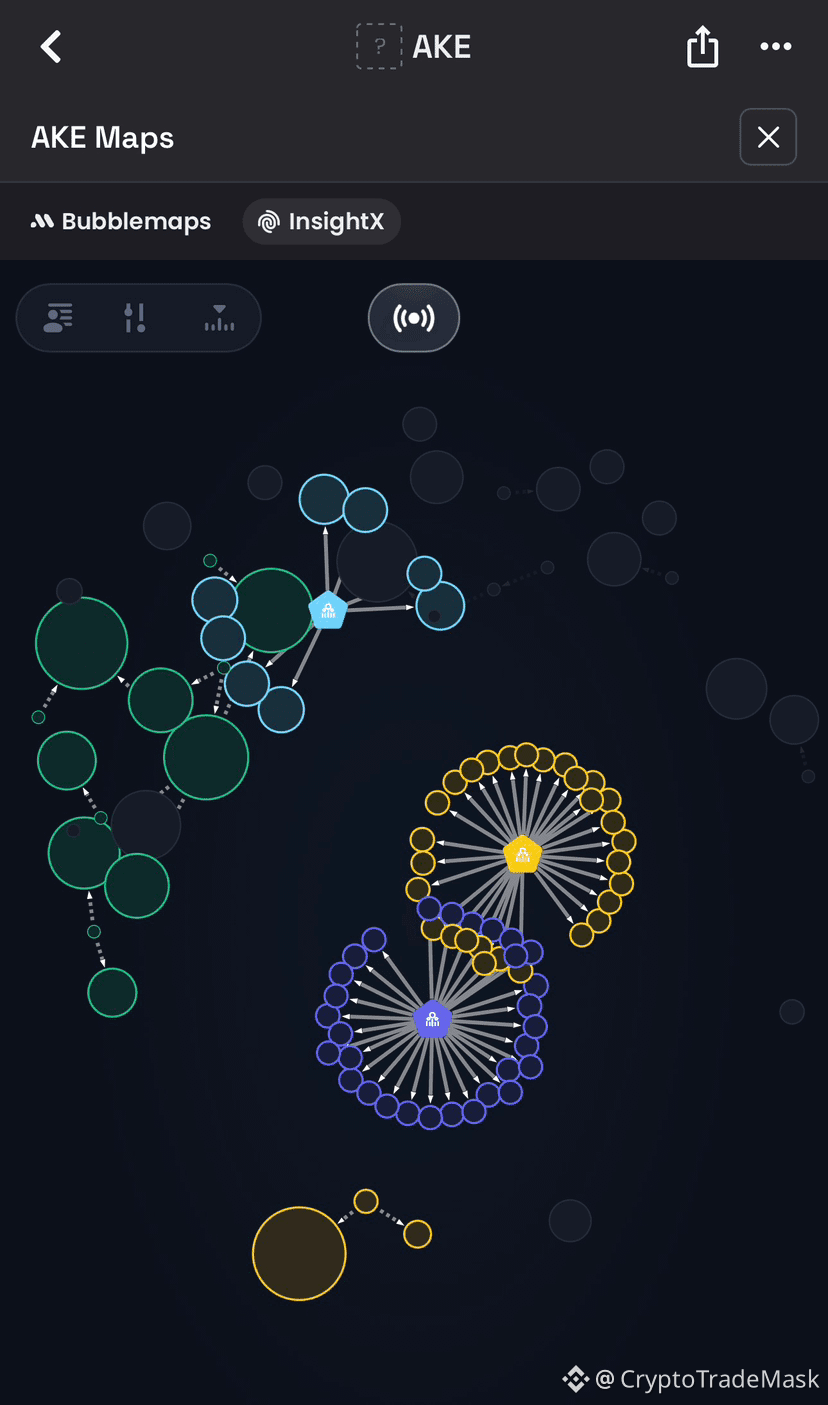
Clusters (Bubblemaps): The connection map clearly shows an organized network of wallets, which typically indicates the activity of sniper bots or control of the coin by a single group of individuals or the developers.
⚠️ Conclusions and risks:
The sharp spike was an artificial pump orchestrated by large players to lock in profits at the expense of retail traders. While the price has now returned to baseline levels, buying the "rebound" is extremely risky—whales still hold a massive volume of coins that could be used for another dump.
Today, we took a detailed look at the metrics and price action of the AKE token (AKE/WBNB). In short—we are looking at a textbook manipulative scheme, and here’s why:
💥 What happened to the price?
Rapid Pump: The price was pushed from a baseline zone of $1.20B–$1.50B to a peak of $3.60B in just a single one-hour candle.
Panic Dump: A long upper wick formed at the peak, followed by an immediate price collapse back to the initial $1.30B–$1.44B range.
💰 What are insiders and insider wallets doing?
Top Traders Locking in Millions: Top addresses dumped tokens en masse at the peak. For instance, wallet 0x1...439 realized a profit of +$619.8K, while 0x6...661 made +$538.4K.
One-Sided Selling: Some top traders didn't buy the token at all during this move; instead, they simply offloaded previously accumulated holdings onto retail buyers driven by FOMO.
🕸 What does on-chain analysis (Holders & Bubblemaps) reveal?
Concentration: The top 10 wallets control about 50% of the total supply.
Clusters (Bubblemaps): The connection map clearly shows an organized network of wallets, which typically indicates the activity of sniper bots or control of the coin by a single group of individuals or the developers.
⚠️ Conclusions and risks:
The sharp spike was an artificial pump orchestrated by large players to lock in profits at the expense of retail traders. While the price has now returned to baseline levels, buying the "rebound" is extremely risky—whales still hold a massive volume of coins that could be used for another dump.