Analysis at 00:00 on 9/21, $ETH
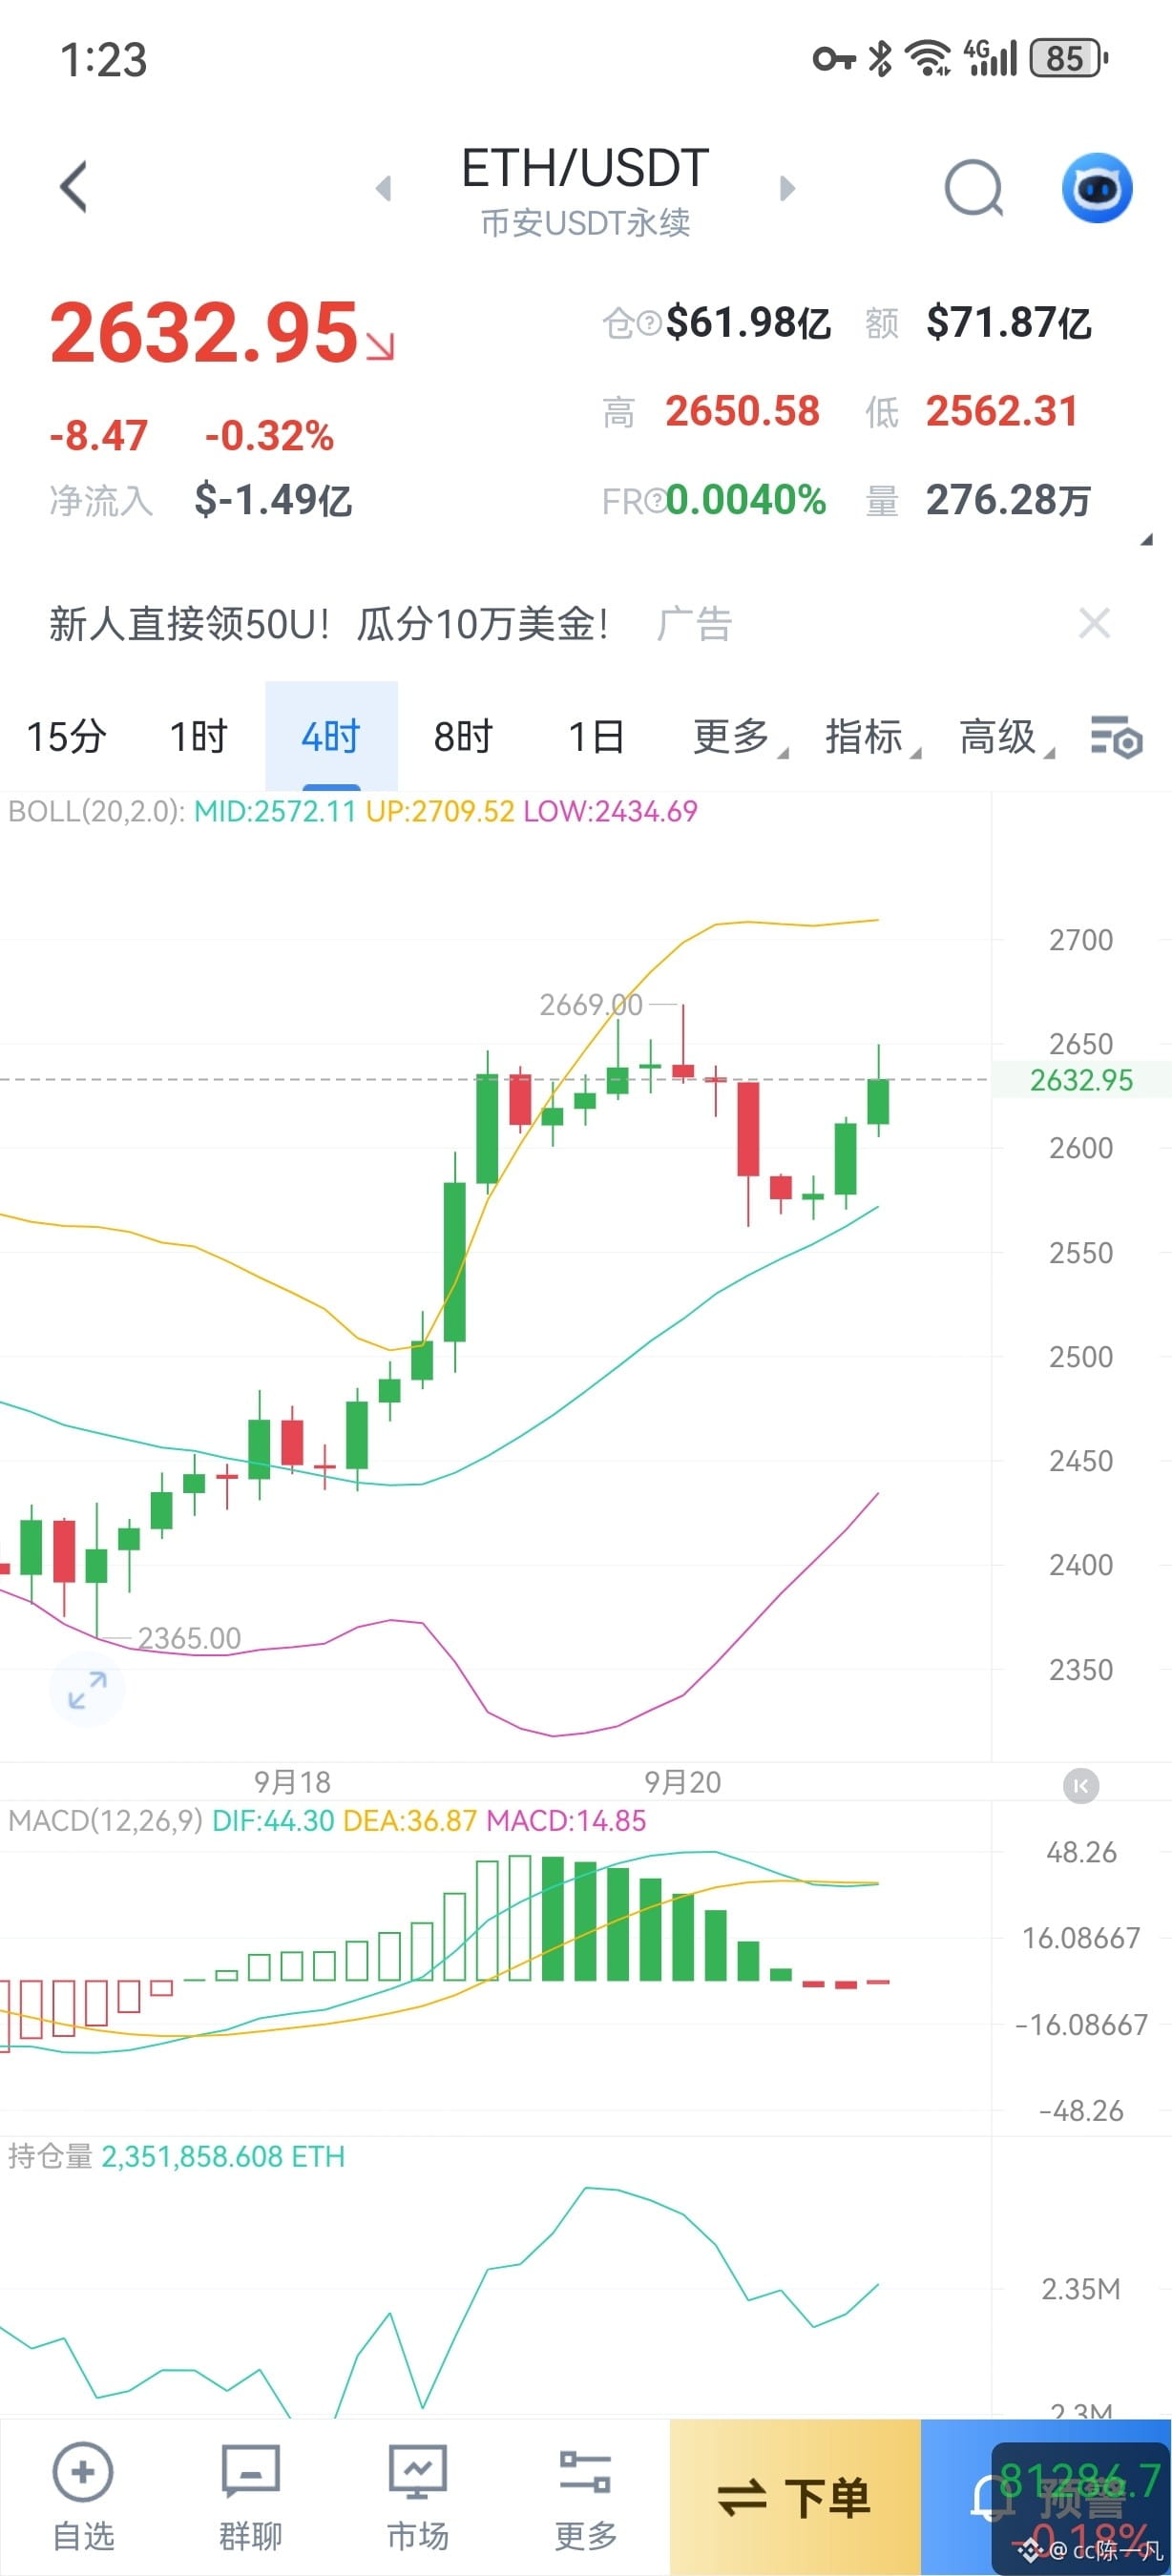
From the 4-hour chart, ETH started a rally from the low point of 2365.00, reaching a peak of 2669.00 before meeting resistance and pulling back. Current price 2632.95 is trading between the Bollinger Band middle line (2572.11) and the upper band (2709.52). The Bollinger Band opening is narrowing, and the market is entering a short-term ranging/sideways zone. On the daily timeframe, price is still trading above the 0.786 Fibonacci support level of 2242. The key resistance above is at the 0.618 level, 2823.
Strong resistance: 2666–2669, the prior high and near the Bollinger upper band; multiple attempts have failed to break through effectively
Short-term support: 2560–2570, the Bollinger middle band and the prior pullback lows
Key support: 2417–2435, the Bollinger lower band and structural lows
Current price has rebounded after finding support near the Bollinger middle band (2572), but resistance around 2666 remains clear. A short-term breakout likely requires confirmation with increased volume.
Market structure: retail longs are crowded, so there is a risk of a shakeout.
The current global retail long/short ratio is as high as 2.25, with about 69% of retail accounts in the long position. This kind of crowded retail-long structure historically often means the market needs to first clear excessive leverage before it can start a sustainable uptrend. #BTC☀ #BTC走势分析 #ETH
From the 4-hour chart, ETH started a rally from the low point of 2365.00, reaching a peak of 2669.00 before meeting resistance and pulling back. Current price 2632.95 is trading between the Bollinger Band middle line (2572.11) and the upper band (2709.52). The Bollinger Band opening is narrowing, and the market is entering a short-term ranging/sideways zone. On the daily timeframe, price is still trading above the 0.786 Fibonacci support level of 2242. The key resistance above is at the 0.618 level, 2823.
Strong resistance: 2666–2669, the prior high and near the Bollinger upper band; multiple attempts have failed to break through effectively
Short-term support: 2560–2570, the Bollinger middle band and the prior pullback lows
Key support: 2417–2435, the Bollinger lower band and structural lows
Current price has rebounded after finding support near the Bollinger middle band (2572), but resistance around 2666 remains clear. A short-term breakout likely requires confirmation with increased volume.
Market structure: retail longs are crowded, so there is a risk of a shakeout.
The current global retail long/short ratio is as high as 2.25, with about 69% of retail accounts in the long position. This kind of crowded retail-long structure historically often means the market needs to first clear excessive leverage before it can start a sustainable uptrend. #BTC☀ #BTC走势分析 #ETH