🟢 What I like about the chart
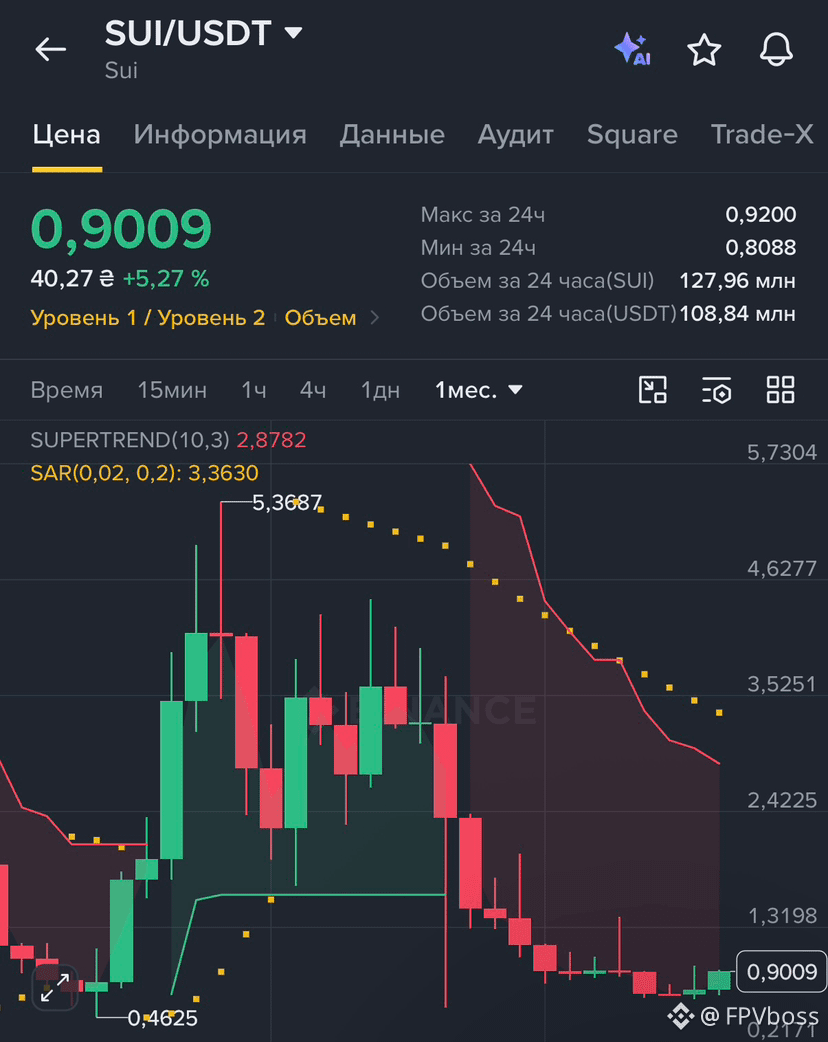
The price has already pulled back significantly from the all-time high around $5.37 and is now trading near the lower end of the historical range.
What’s especially interesting is that the last monthly candles have stopped making such a sharp decline and have started stabilizing around $0.8–0.9.
If SUI can hold above $0.90–1.00, the next major area would roughly be:
$1.32 → $2.42 → $2.88–3.36
And breaking through the $2.8–3.4 zone would be a much more serious sign of a long-term trend change.
⚠️ Where the danger is
If the current $0.80–0.90 zone doesn’t hold, the next noticeable historical area on the chart is about $0.46, and below that—around $0.22.
So right now I would look at the situation like this:
$0.80–0.90 — the zone where a bottom attempt is forming.
$1.00+ — the first improvement.
$1.32 — a key resistance level.
$2.4–2.9 — already a serious test of a reversal. $SUI
The price has already pulled back significantly from the all-time high around $5.37 and is now trading near the lower end of the historical range.
What’s especially interesting is that the last monthly candles have stopped making such a sharp decline and have started stabilizing around $0.8–0.9.
If SUI can hold above $0.90–1.00, the next major area would roughly be:
$1.32 → $2.42 → $2.88–3.36
And breaking through the $2.8–3.4 zone would be a much more serious sign of a long-term trend change.
⚠️ Where the danger is
If the current $0.80–0.90 zone doesn’t hold, the next noticeable historical area on the chart is about $0.46, and below that—around $0.22.
So right now I would look at the situation like this:
$0.80–0.90 — the zone where a bottom attempt is forming.
$1.00+ — the first improvement.
$1.32 — a key resistance level.
$2.4–2.9 — already a serious test of a reversal. $SUI