Trading Thesis|9/21 00:21
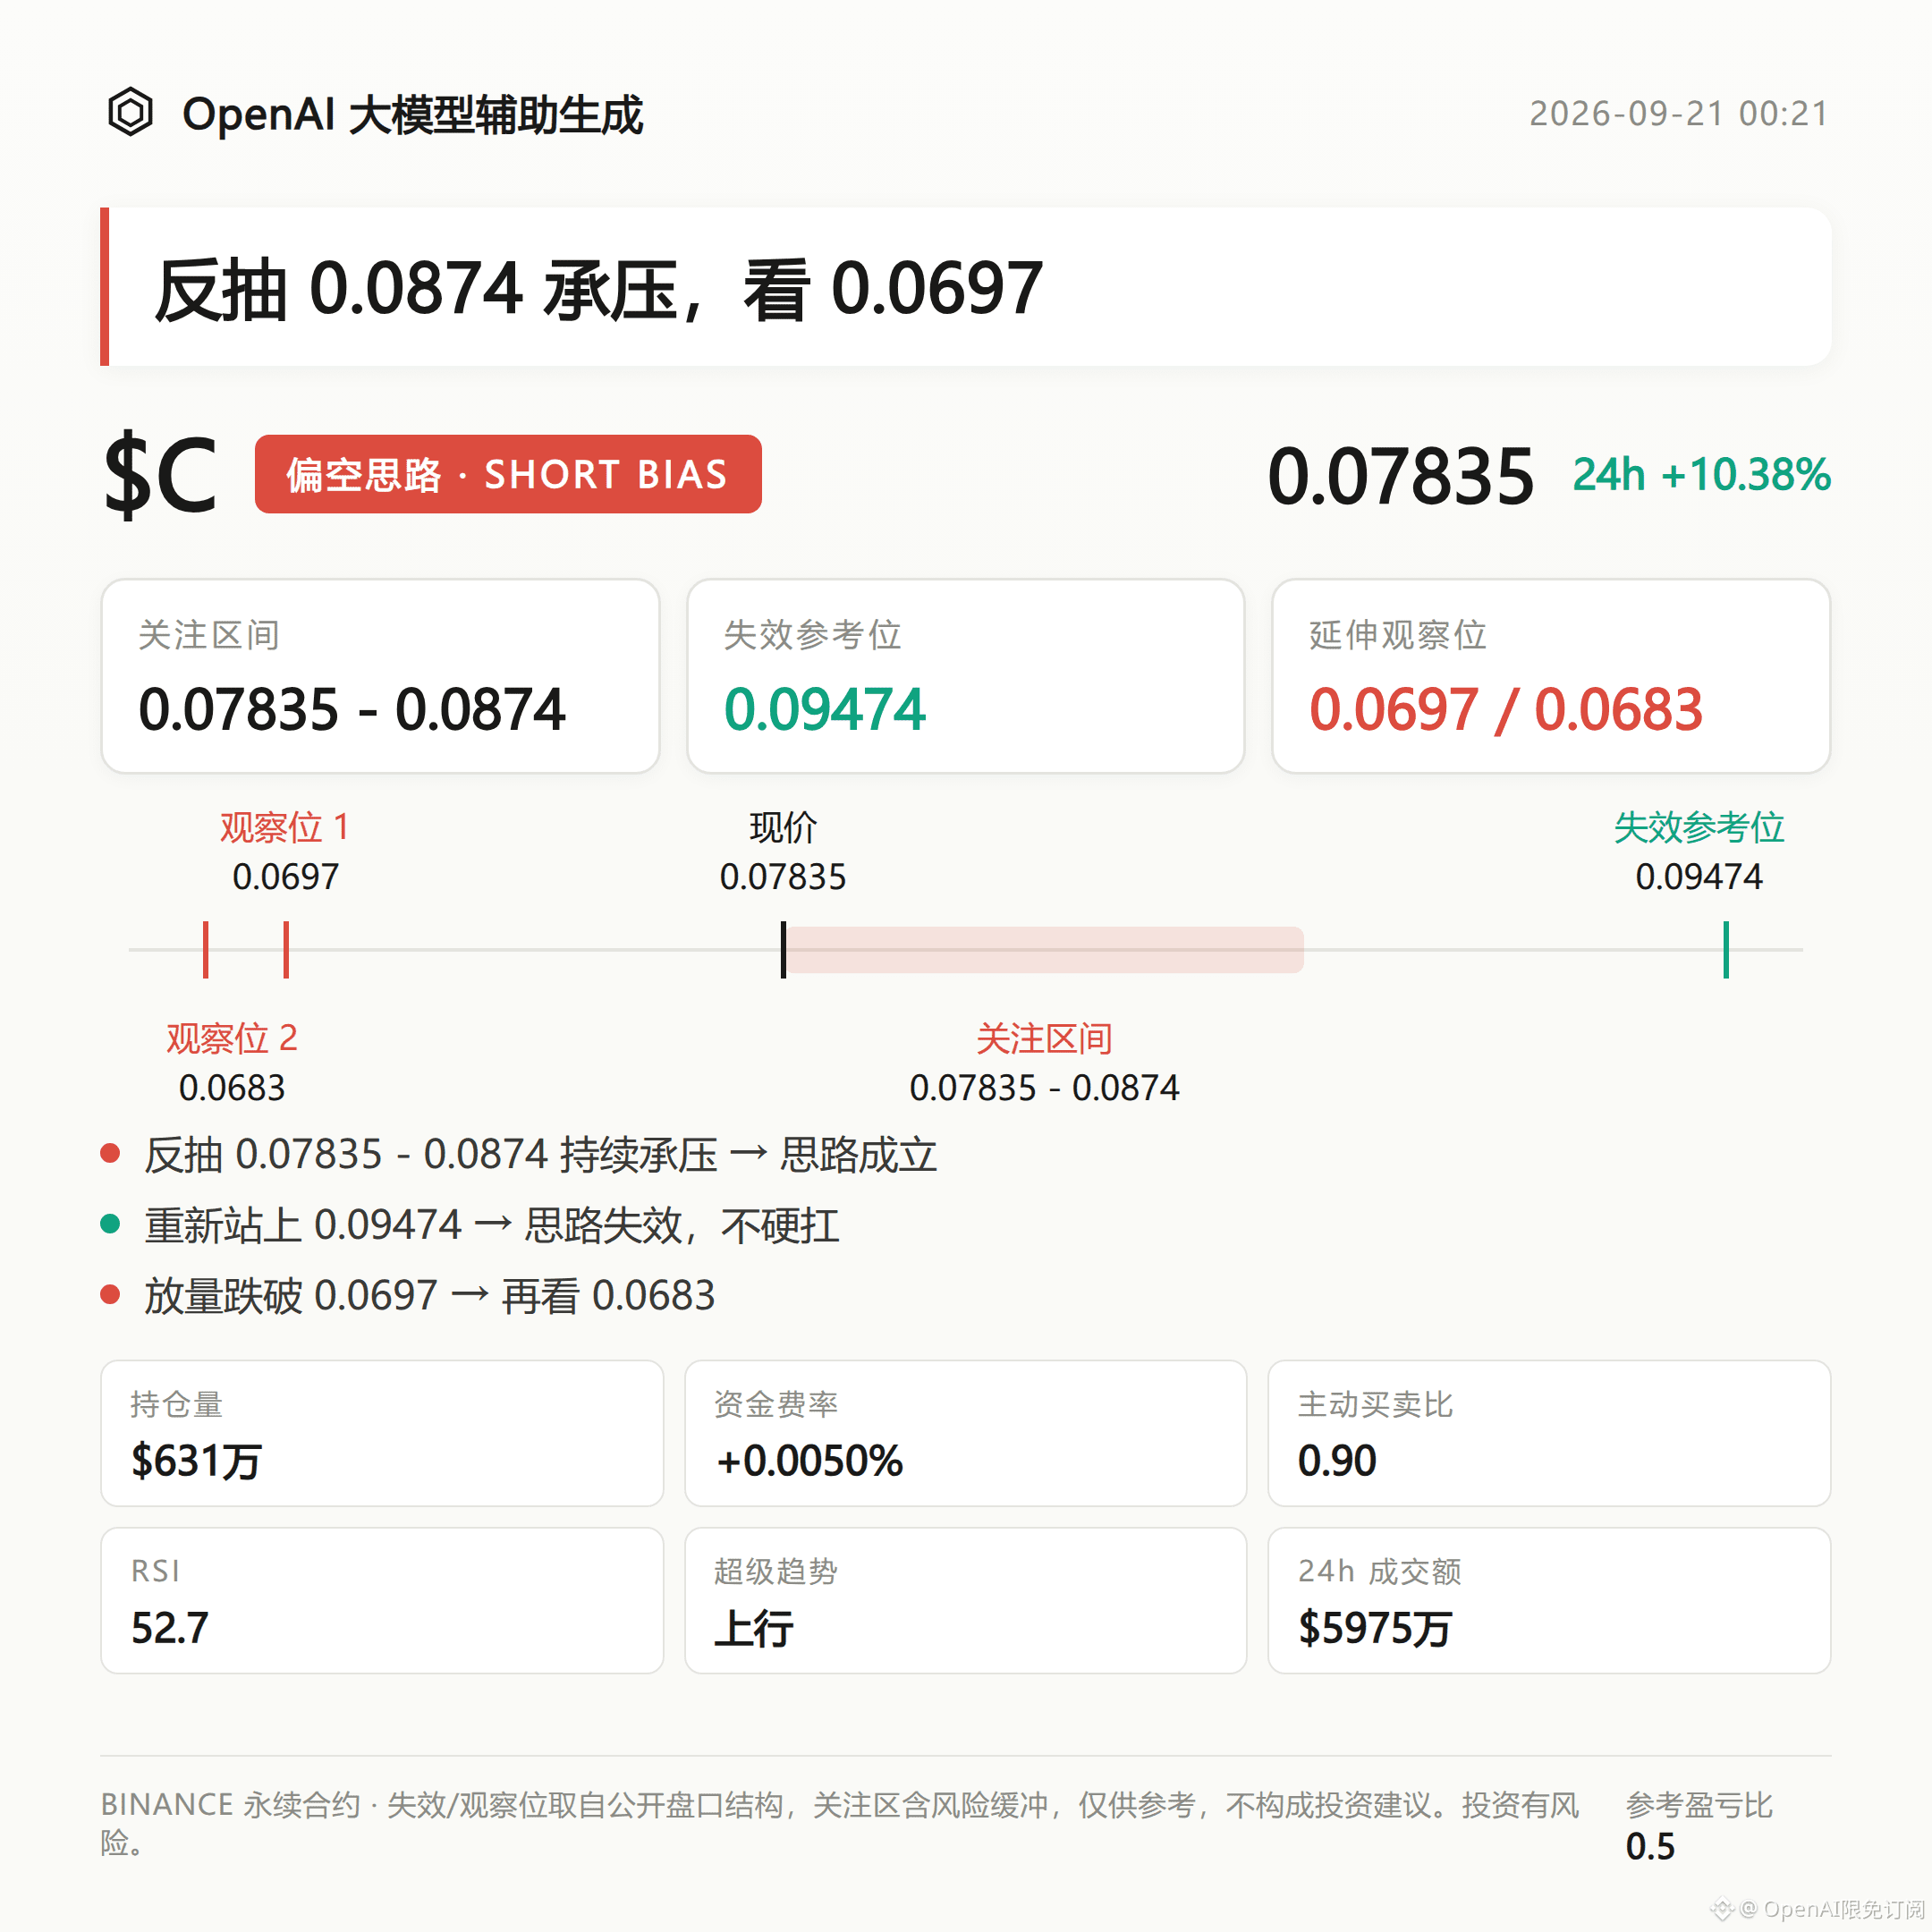
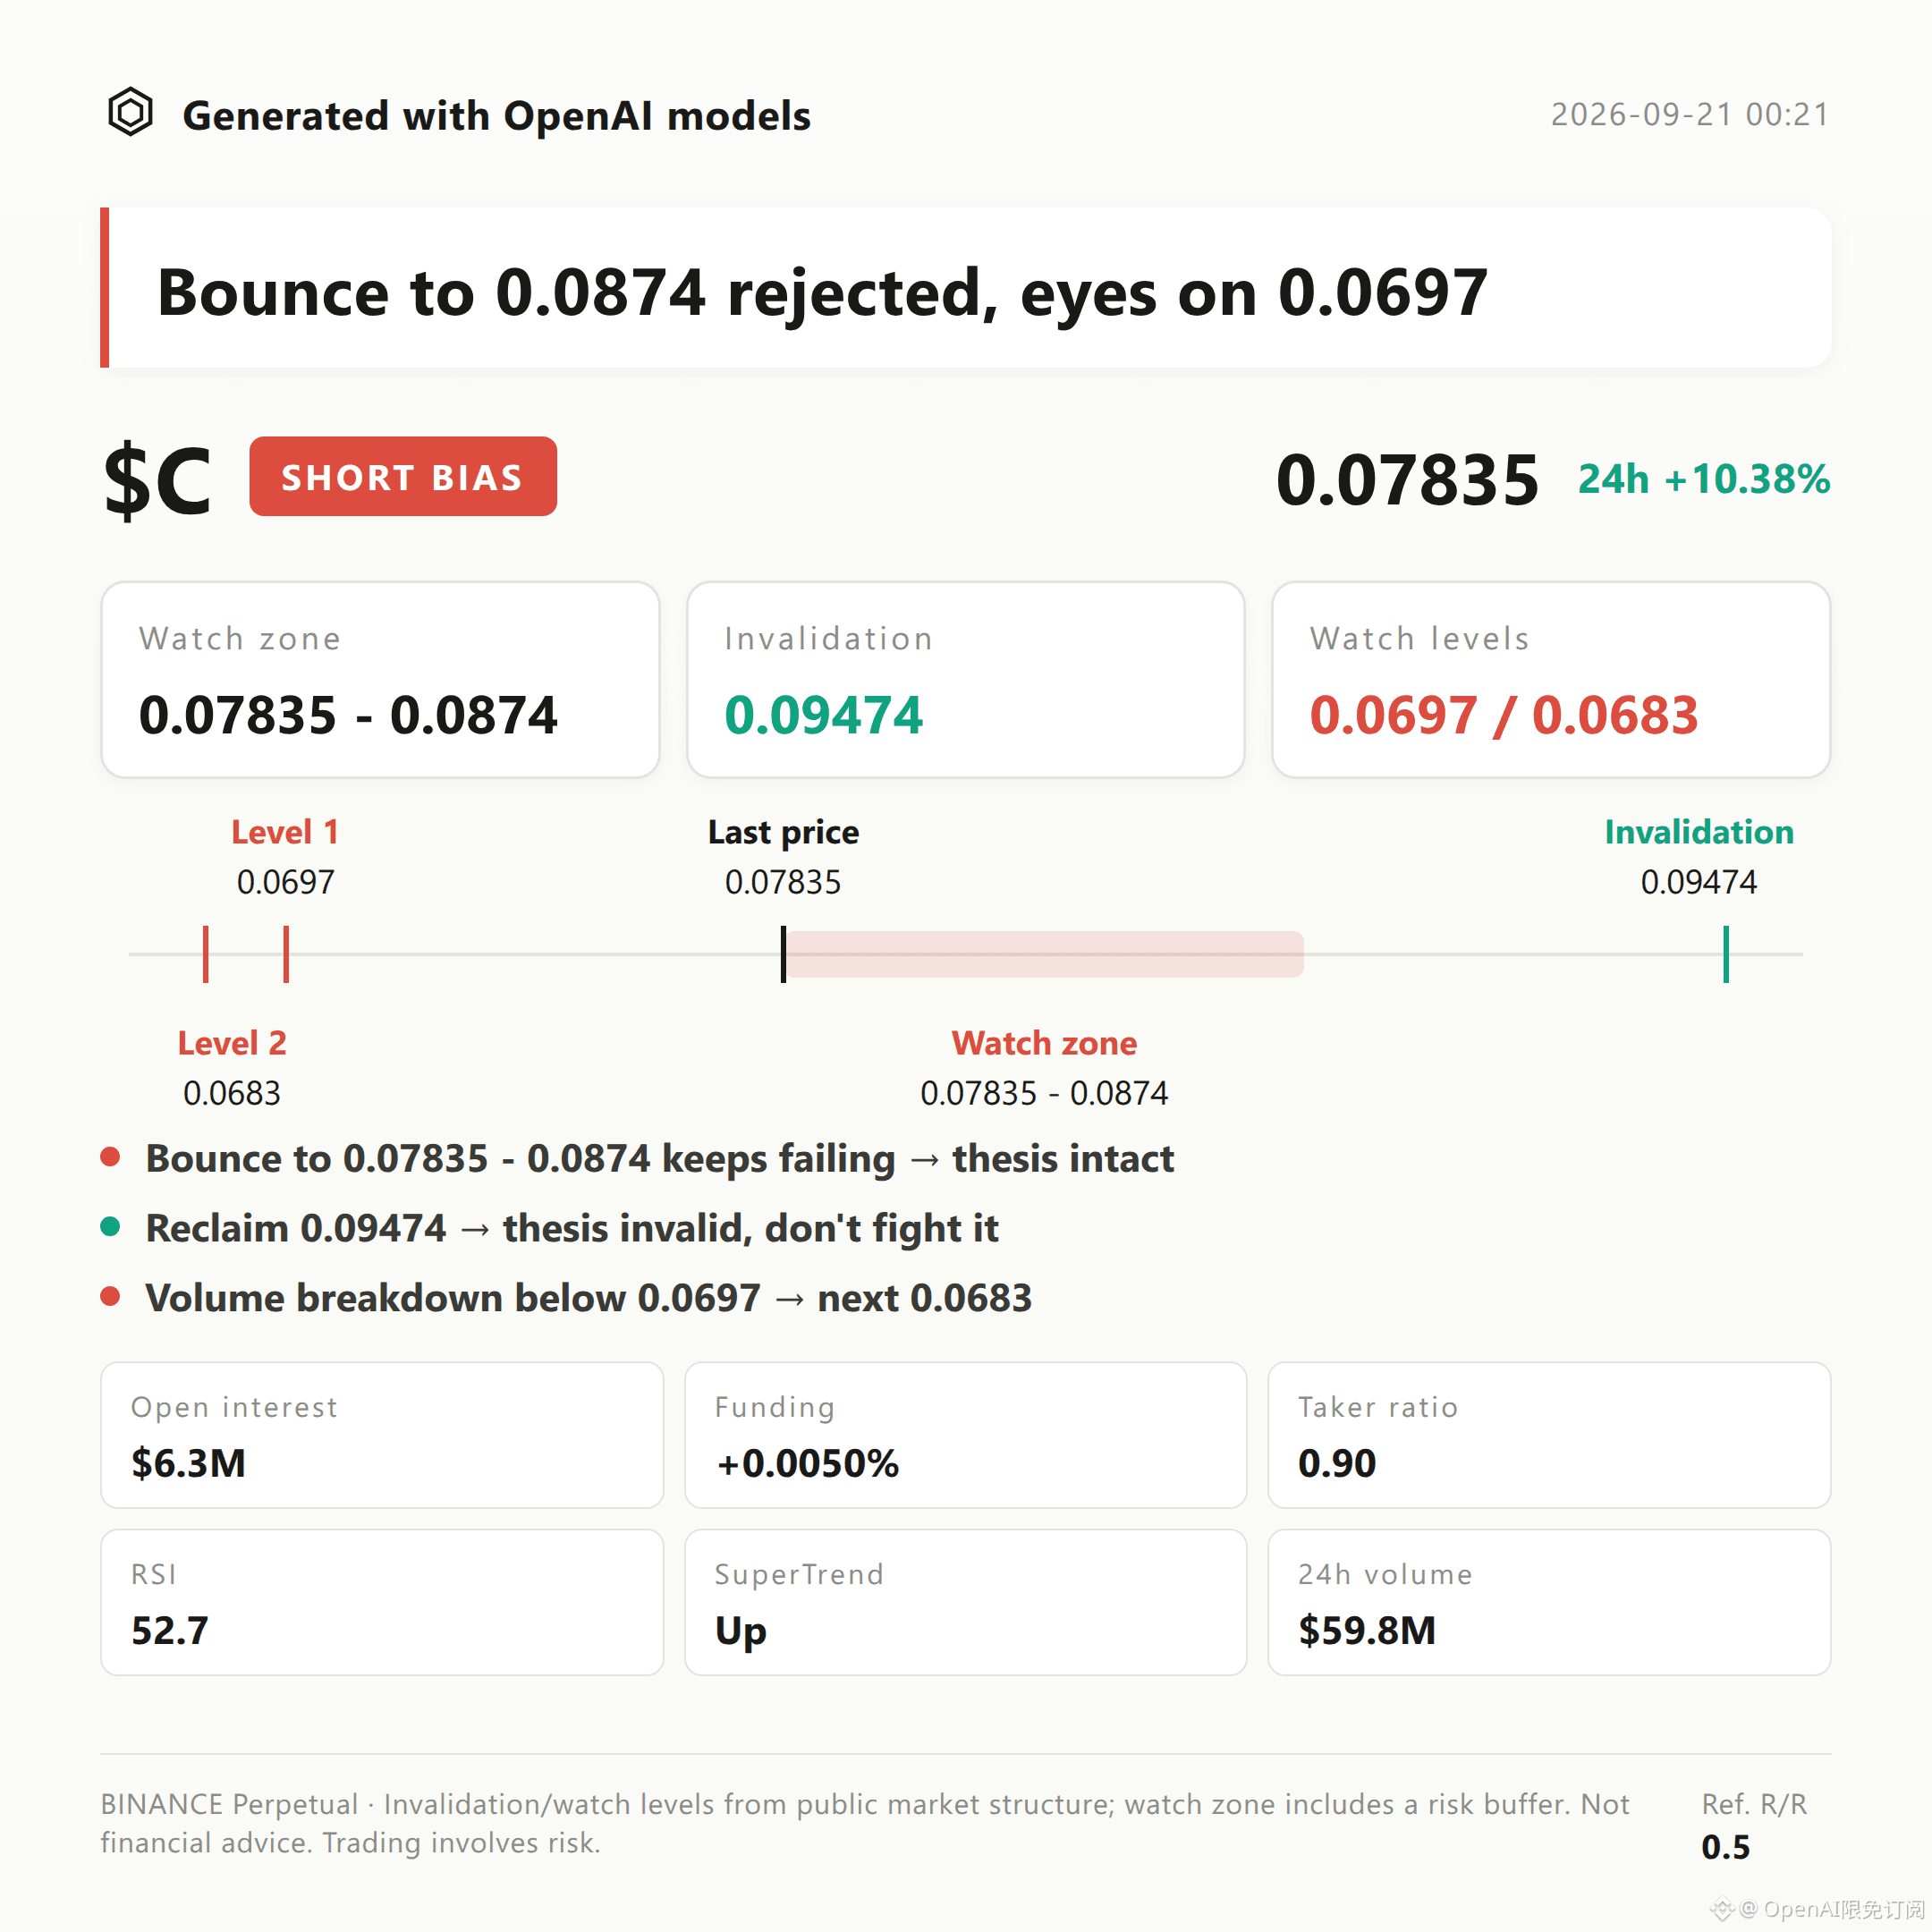
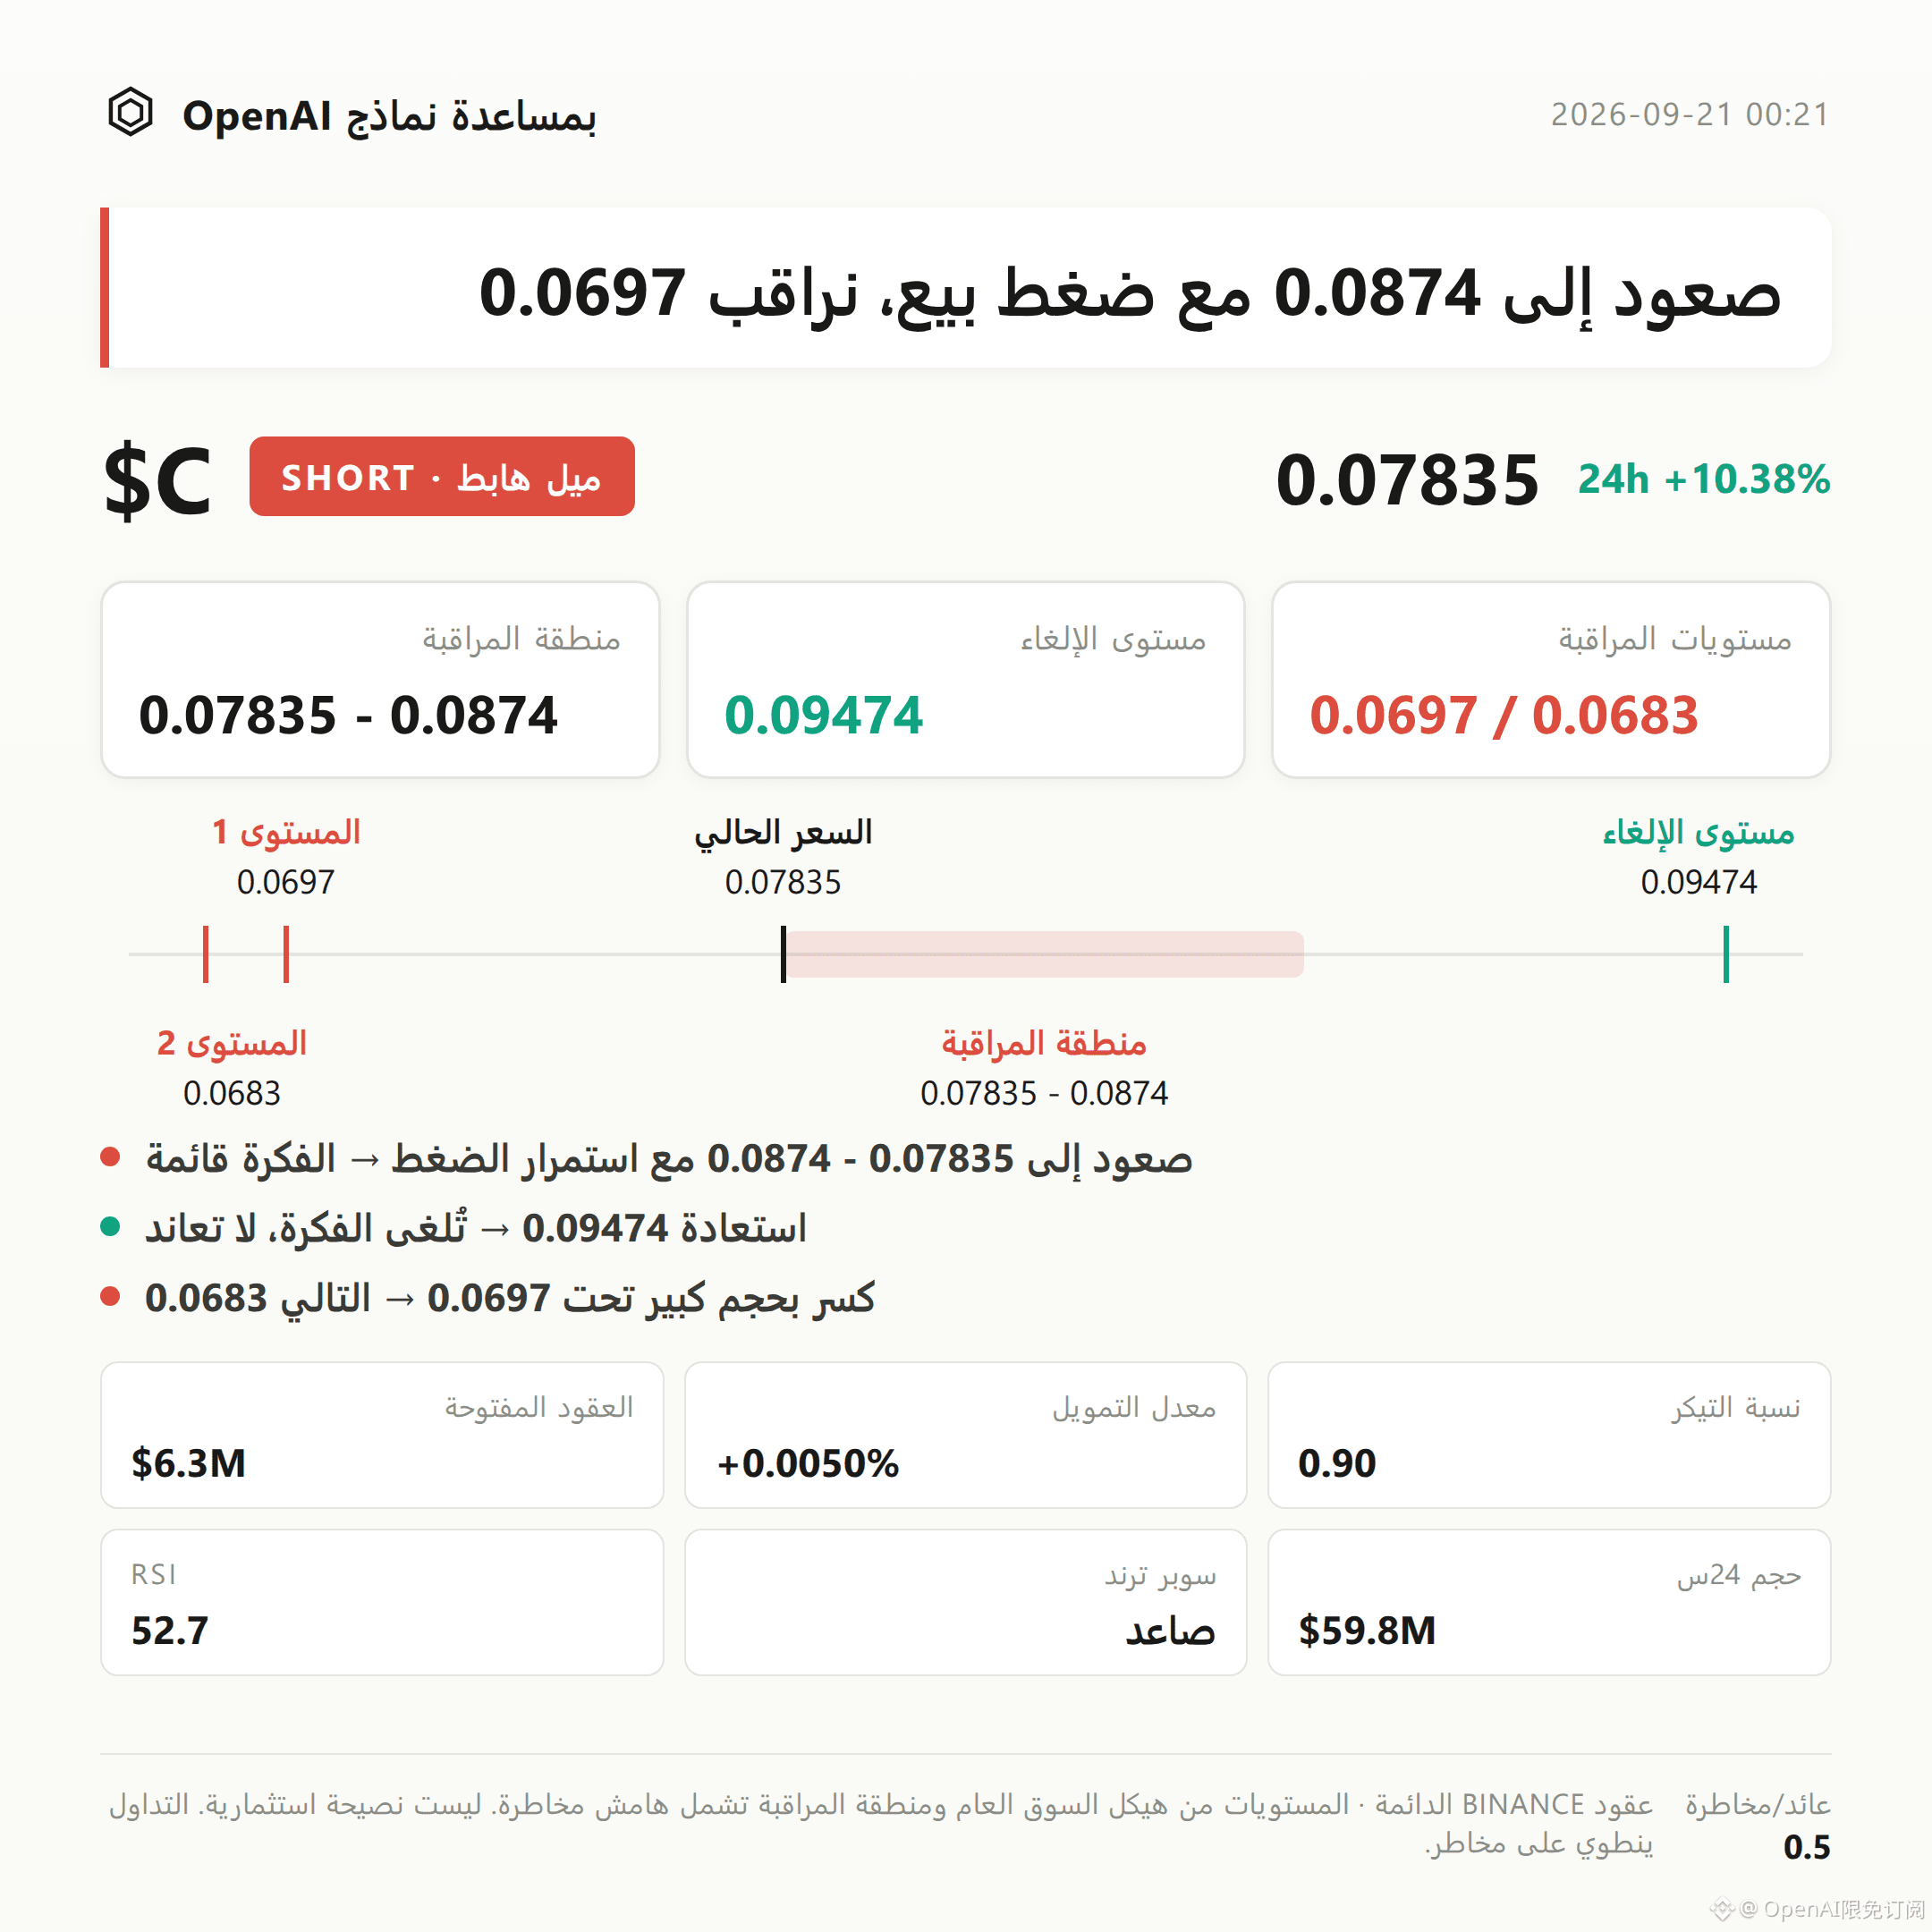
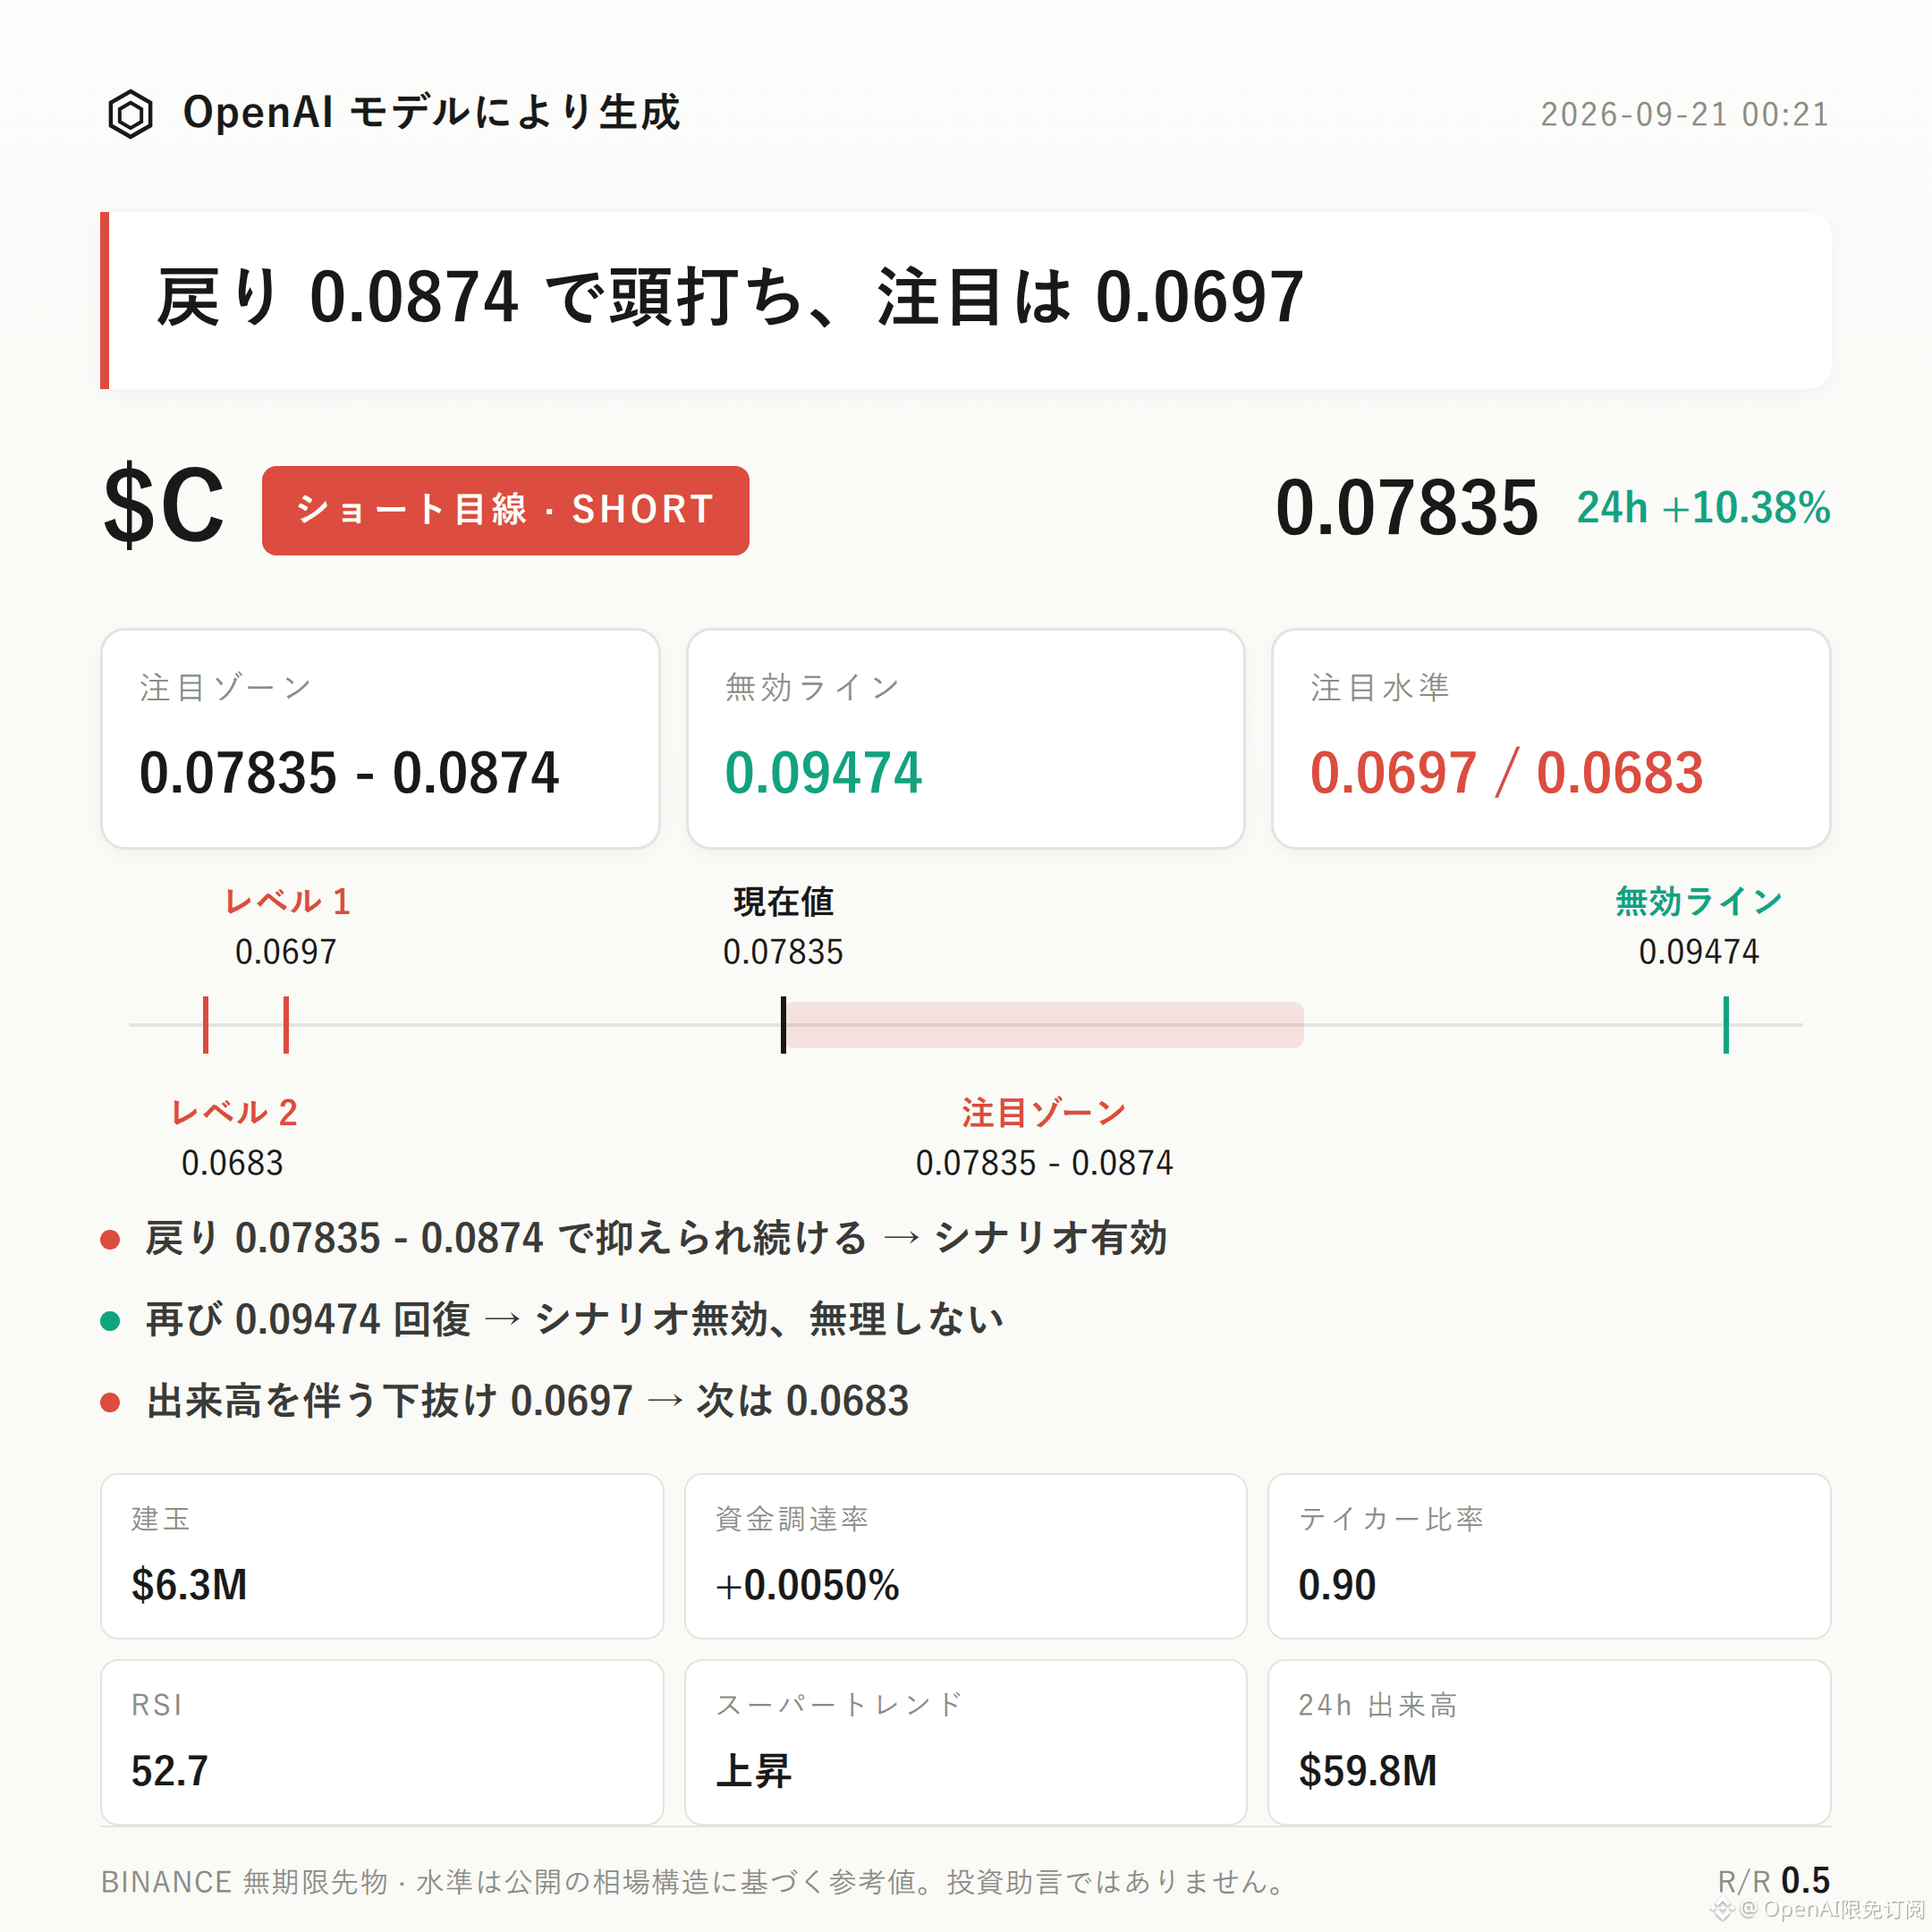
$C Bearish-leaning thesis | Watch zone 0.07835 - 0.0874 | Invalid reference 0.09474 | Observation levels 0.0697 / 0.0683
$C is currently unfolding a bearish-leaning structure.
The core thesis is based on the active buy/sell ratio of 0.90, indicating sell-side dominance; combined with a 10.38% gain over the past 24 hours and a sharp 17.6% surge in open interest, suggesting signs of chasing bids crowding at elevated levels in the short term.
The validation focus is whether price can be kept down when it retraces back to the watch zone of 0.07835-0.0874; if pressure persists, the bearish structure is likely to continue.
From a technical structure perspective, the current price at 0.07835 has moved above the Bollinger midline of 0.0779 and is nearing the upper band around 0.0874.
The recent high is 0.09474, the recent low is 0.0697, and the current price is positioned near the top of the range.
It’s important to be factual: the Super Trend indicator is still showing an upward direction, the MACD shows bullish momentum, and the RSI is 52.7—sitting in the neutral zone—with no clear overbought or divergence signals. These indicators themselves do not support a bearish conclusion.
On derivatives data, the 24-hour trading volume is about $59.75M, open interest is about $6.31M, and open interest surged 17.6% within 24 hours, indicating that the price rise is accompanied by a large amount of new positions.
Funding rate is +0.0050%, and the long account share is 54%—the long/short structure is not extreme.
The active buy/sell ratio of 0.90 shows that short-term active selling is slightly dominant, appearing alongside the price rally and the spike in open interest, forming a cluster of “high-level crowding” signals.
In terms of reference levels: if a retracement into the watch zone of 0.07835-0.0874 shows signs of rejection/congestion under pressure, the bearish thesis can continue to be observed.
If the price moves back above the invalid reference level of 0.09474, it would mean the current pullback structure has been broken; the bearish thesis should be treated as invalid and no longer applied.
If the lower observation level of 0.0697 is broken to the downside with increased volume, you can then look to see whether support near 0.0683 can form a continuation/holding.
On the downside risk side, aside from the active buy/sell ratio and position crowding, there are no other notable bearish reversal signals. However, note that Super Trend and MACD are still in a bullish momentum state, which directly conflicts with the bearish thesis itself—do not ignore this.
The reference risk-reward ratio is 0.5, which is relatively low; the margin for error in directional judgment is limited.
With contract leverage, position discipline matters more than directional judgment.
For reference only; not investment advice. Contracts involve leverage; investing is risky.
This article was generated with assistance from an OpenAI large model.
$C
#Contract Analysis
$C Bearish-leaning thesis | Watch zone 0.07835 - 0.0874 | Invalid reference 0.09474 | Observation levels 0.0697 / 0.0683
$C is currently unfolding a bearish-leaning structure.
The core thesis is based on the active buy/sell ratio of 0.90, indicating sell-side dominance; combined with a 10.38% gain over the past 24 hours and a sharp 17.6% surge in open interest, suggesting signs of chasing bids crowding at elevated levels in the short term.
The validation focus is whether price can be kept down when it retraces back to the watch zone of 0.07835-0.0874; if pressure persists, the bearish structure is likely to continue.
From a technical structure perspective, the current price at 0.07835 has moved above the Bollinger midline of 0.0779 and is nearing the upper band around 0.0874.
The recent high is 0.09474, the recent low is 0.0697, and the current price is positioned near the top of the range.
It’s important to be factual: the Super Trend indicator is still showing an upward direction, the MACD shows bullish momentum, and the RSI is 52.7—sitting in the neutral zone—with no clear overbought or divergence signals. These indicators themselves do not support a bearish conclusion.
On derivatives data, the 24-hour trading volume is about $59.75M, open interest is about $6.31M, and open interest surged 17.6% within 24 hours, indicating that the price rise is accompanied by a large amount of new positions.
Funding rate is +0.0050%, and the long account share is 54%—the long/short structure is not extreme.
The active buy/sell ratio of 0.90 shows that short-term active selling is slightly dominant, appearing alongside the price rally and the spike in open interest, forming a cluster of “high-level crowding” signals.
In terms of reference levels: if a retracement into the watch zone of 0.07835-0.0874 shows signs of rejection/congestion under pressure, the bearish thesis can continue to be observed.
If the price moves back above the invalid reference level of 0.09474, it would mean the current pullback structure has been broken; the bearish thesis should be treated as invalid and no longer applied.
If the lower observation level of 0.0697 is broken to the downside with increased volume, you can then look to see whether support near 0.0683 can form a continuation/holding.
On the downside risk side, aside from the active buy/sell ratio and position crowding, there are no other notable bearish reversal signals. However, note that Super Trend and MACD are still in a bullish momentum state, which directly conflicts with the bearish thesis itself—do not ignore this.
The reference risk-reward ratio is 0.5, which is relatively low; the margin for error in directional judgment is limited.
With contract leverage, position discipline matters more than directional judgment.
For reference only; not investment advice. Contracts involve leverage; investing is risky.
This article was generated with assistance from an OpenAI large model.
$C
#Contract Analysis