$ETH cryptocurrency market academicians: 9.21 Ethereum (ETH) — don’t be misled by short-term pullbacks; take a deep dive into the structure behind this rally? Latest market analysis reference
Ethereum is currently trading at 2645. The most frustrating thing is the sideways chop at high levels. When the direction hasn’t broken out yet, getting slapped back and forth is the norm. Many people always want to catch every move, but frequent trading leads to continual losses. Trading doesn’t have to mean entering every moment. When you can’t read the market, the best action is to stay in cash. Technical analysis is just a tool—risk control is the real foundation for survival. Don’t fantasize that every trade will be profitable. Keep your loss limit, and it’s enough to profit from the setups you can understand
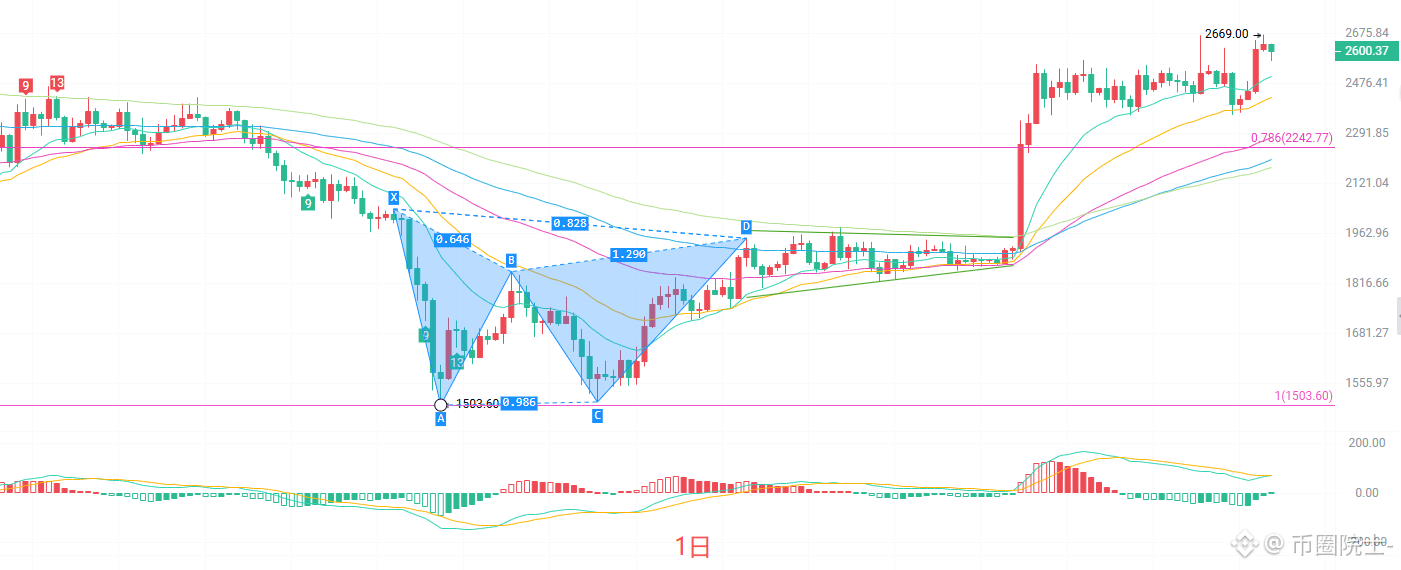
On the daily K-line, the previous leg started from the low at 1503 and launched a strong rebound. The current price is trading above the 0.786 Fibonacci level at 2242. The resistance above is at the 0.618 level, 2823. The MACD histogram’s red bars are gradually converging, while DIF and DEA are still above the zero line, though bullish momentum is starting to weaken. The Bollinger Bands are narrowing, and price is moving between the upper band and the middle band. The daily K-line has entered a high-range consolidation zone. In the short term, it most likely won’t immediately break into a one-way surge; consolidation and digestion are the main theme
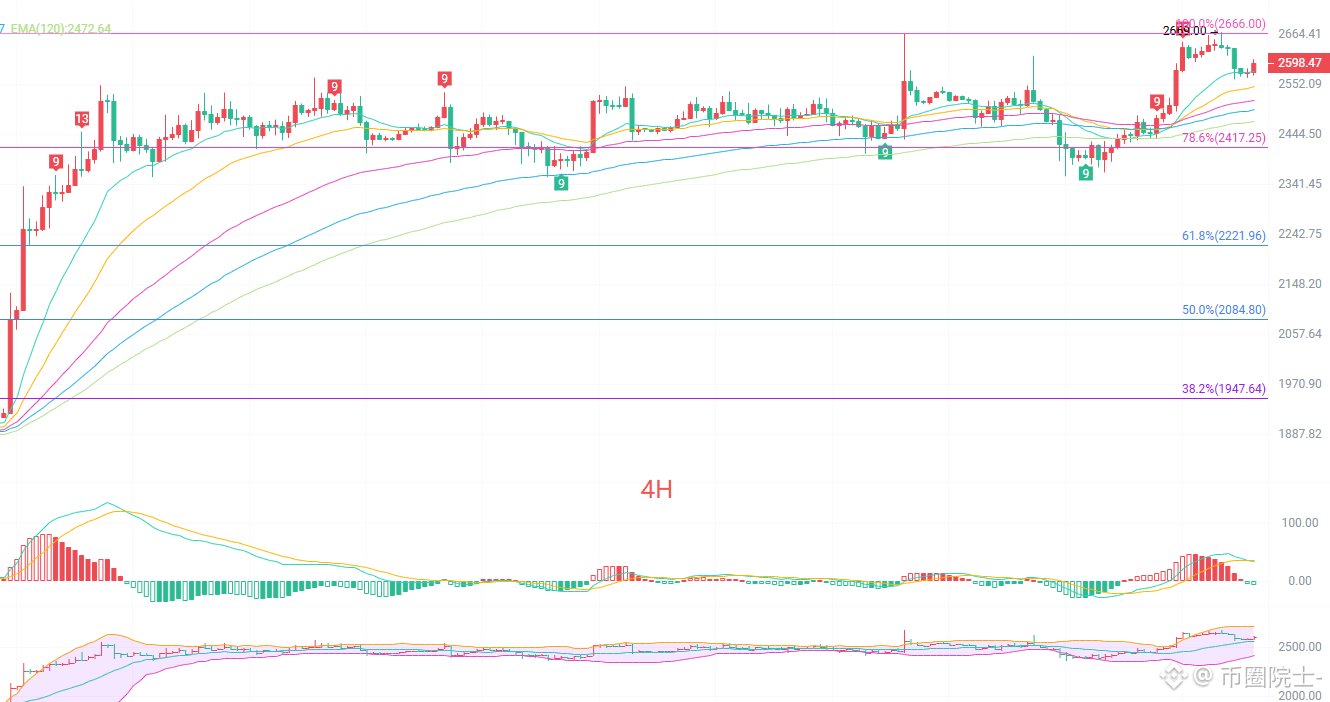
On the four-hour K-line, the EMA moving averages are in a bullish alignment, but price has already fallen below the short-term moving averages. MACD has formed a dead cross in the high zone, and the green histogram continues to expand—there’s a need for a short-term pullback. The upper Bollinger band at 2707 is under pressure. The current price has fallen back to test support around the middle band. Strong resistance is at 2666 above, while the key support is at 2417 below. In this pullback phase of the high-level bulls, it is a consolidation correction after the upward move; the larger structure has not turned bearish
Short-term reference:
If the market breaks down north from 2570 to 2560, place a stop-loss at 40 points, and look for targets at 2650 to 2666
If price does not break down between 2650 and 2666, go long/hold with a stop-loss at 40 points, and look for targets at 2600 to 2570
Specific actions should be based on real-time order book data. For more information, you can check the author’s updates. The article has a publication delay, so this is for reference only—risk is your own
#ETH走势分析
Ethereum is currently trading at 2645. The most frustrating thing is the sideways chop at high levels. When the direction hasn’t broken out yet, getting slapped back and forth is the norm. Many people always want to catch every move, but frequent trading leads to continual losses. Trading doesn’t have to mean entering every moment. When you can’t read the market, the best action is to stay in cash. Technical analysis is just a tool—risk control is the real foundation for survival. Don’t fantasize that every trade will be profitable. Keep your loss limit, and it’s enough to profit from the setups you can understand
On the daily K-line, the previous leg started from the low at 1503 and launched a strong rebound. The current price is trading above the 0.786 Fibonacci level at 2242. The resistance above is at the 0.618 level, 2823. The MACD histogram’s red bars are gradually converging, while DIF and DEA are still above the zero line, though bullish momentum is starting to weaken. The Bollinger Bands are narrowing, and price is moving between the upper band and the middle band. The daily K-line has entered a high-range consolidation zone. In the short term, it most likely won’t immediately break into a one-way surge; consolidation and digestion are the main theme
On the four-hour K-line, the EMA moving averages are in a bullish alignment, but price has already fallen below the short-term moving averages. MACD has formed a dead cross in the high zone, and the green histogram continues to expand—there’s a need for a short-term pullback. The upper Bollinger band at 2707 is under pressure. The current price has fallen back to test support around the middle band. Strong resistance is at 2666 above, while the key support is at 2417 below. In this pullback phase of the high-level bulls, it is a consolidation correction after the upward move; the larger structure has not turned bearish
Short-term reference:
If the market breaks down north from 2570 to 2560, place a stop-loss at 40 points, and look for targets at 2650 to 2666
If price does not break down between 2650 and 2666, go long/hold with a stop-loss at 40 points, and look for targets at 2600 to 2570
Specific actions should be based on real-time order book data. For more information, you can check the author’s updates. The article has a publication delay, so this is for reference only—risk is your own
#ETH走势分析