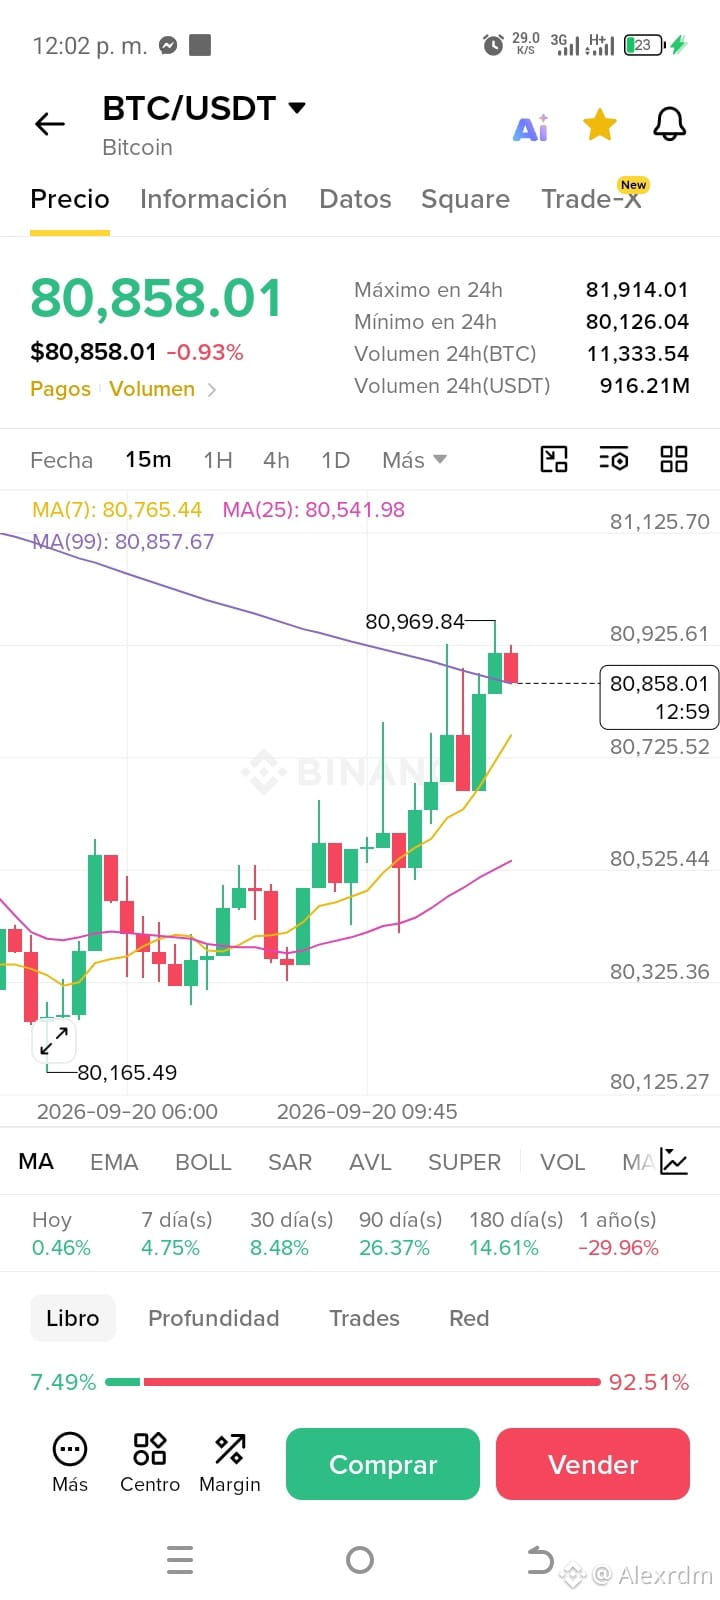
The chart of $BTC is trading at $80,858.01, showing a recovery from the lows of $80,165.49 and testing the break of the MA(99).
Technical Structure Analysis (15m)
MA(99) Test: The price temporarily moved above the MA(99) ($80,857.67) by marking a local high at $80,969.84, but the current candle reflects pullback and indecision right over this moving average.
Short Moving Averages with a Bullish Slope: The MA(7) ($80,765.44) is crossing upward over the MA(25) ($80,541.98), acting as the first dynamic support for the current rise.
Order Book Sell Pressure: Depth shows overwhelming sell dominance with 92.51% Supply vs. 7.49% Demand. There are heavy sell walls accumulated above $81,000.
Operational Impact and Recommendation
Required Confirmation: There is no confirmation of a trend change in favor of the bulls until a 15m candle closes with a full body above $81,000, breaking through the sell block.
$NVDAB $LINK
Technical Structure Analysis (15m)
MA(99) Test: The price temporarily moved above the MA(99) ($80,857.67) by marking a local high at $80,969.84, but the current candle reflects pullback and indecision right over this moving average.
Short Moving Averages with a Bullish Slope: The MA(7) ($80,765.44) is crossing upward over the MA(25) ($80,541.98), acting as the first dynamic support for the current rise.
Order Book Sell Pressure: Depth shows overwhelming sell dominance with 92.51% Supply vs. 7.49% Demand. There are heavy sell walls accumulated above $81,000.
Operational Impact and Recommendation
Required Confirmation: There is no confirmation of a trend change in favor of the bulls until a 15m candle closes with a full body above $81,000, breaking through the sell block.
$NVDAB $LINK